
Originally published at: https://discgolf.ultiworld.com/2018/08/07/little-ob-can-go-long-way/
[caption id=“attachment_9916” align=“aligncenter” width=“1024”]
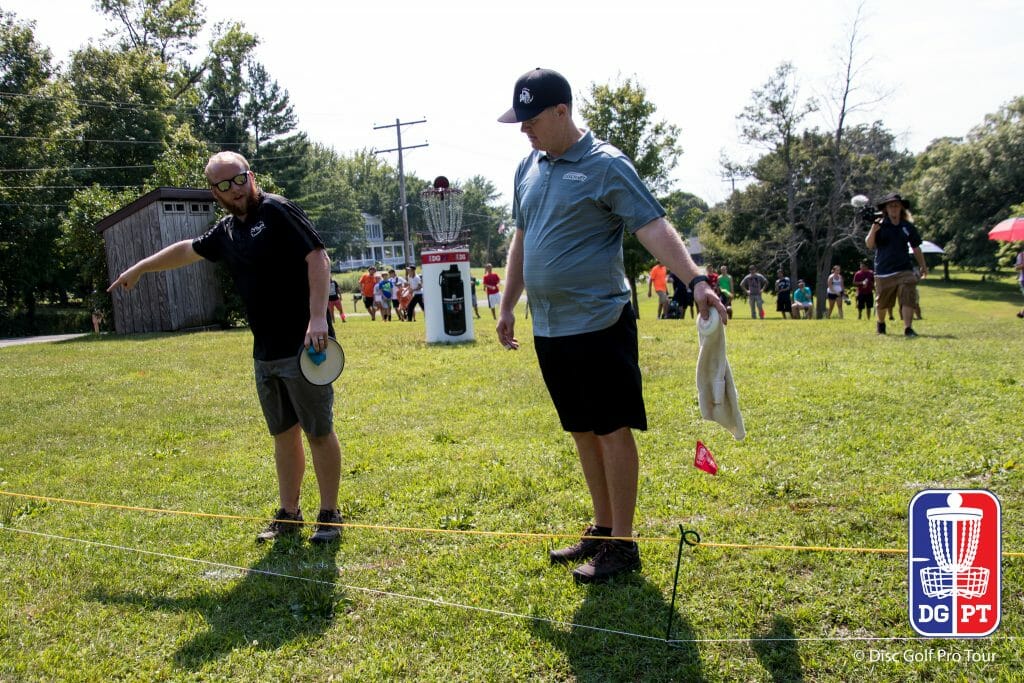
In the 4th round, Central Coast Disc Golf coverage of the 2017 Ledgestone Insurance Open Tournament Director Nate Heinold said, “I’ve tried to design the US Open of disc golf. The US Open of ball golf is an incredibly challenging test where par is a good score and I’m trying to punish bad shots.”
Anyone who has played or seen his Lake Eureka course knows he has gone to great lengths in reaching that goal, in part because of the significant amount of out of bounds (OB) there. It is very possible (even likely in some cases) to send an errant shot OB on many holes at this course, where the Open division competed exclusively in all four rounds last year, and will again this season. And throwing your disc OB is bad unless it isn’t.
Using data from UDisc Live, I found that players who placed well at a tournament tended to have OB rates that were not the lowest in the field.
At first glance, this idea should be very counter-intuitive to you. Throwing OB adds strokes to your score, and yet, if you look at all tournaments with UDisc Live data the expected place for an individual that had an OB rate of zero was 42nd, which is a pretty long way off from the top. On the other hand, the average OB rate for players that finish in the top 10 is .074. ((Following UDisc Live’s definition of OB Rate, it is “the total number of OB strokes divided by the total number of holes tracked, similar to a batting average in baseball - if one has an OB Rate of 0.056, they threw OB on 5.6% of tracked holes.”)) That is not a lot of OB throws, but it is definitely more than a rate of zero. You can see how this pattern played out across all place values in the plot below. ((These results are extremely statistically significant. Though, it is important to note two things, 1) the response variable is not normally distributed, so I would take the statistical results with a grain of salt and 2) this does not, however, invalidate the best fit line.))
[caption id=“attachment_9937” align=“aligncenter” width=“531”]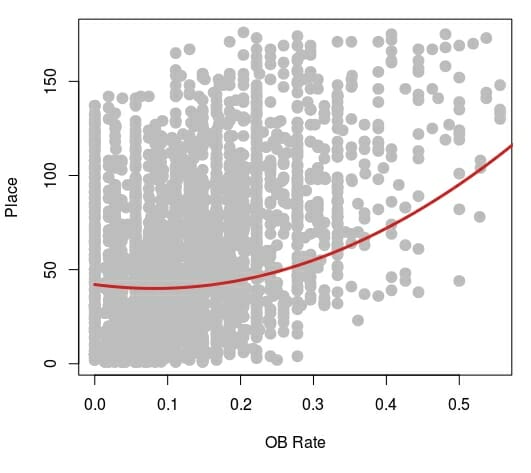 Plot of OB rate vs. place for all tournaments with data available from UDisc Live. The red line indicates the best fit line from a regression that includes OB rate, OB rate squared, and scrambling as explanatory variables.[/caption]
The plot is not the easiest to read, but what you can clearly see is that as OB rate initially increased from 0% the best fit line for place, or the expected place a player should get in the tournament, actually decreased. This means the player should finish the tournament closer to first place. Eventually, the line changes direction and increased, which means that a lot of OB throws resulted in a finish farther from first place.
The pattern is even more clear if you look at the data from just the 2016 and 2017 Ledgestone Insurance Open shown in the plot below. Look at how strong the ‘u’ shape is to that best fit line. Again, it indicates that a little OB is indicative of a better finish, but a lot of OB or too little OB results in a lower finish. For example, the winner of the 2017 Ledgestone, Josh Anthon, threw OB at a rate of .056 which was pretty close to the .074 average for top-10 finishers across all tournaments.
[caption id=“attachment_9938” align=“aligncenter” width=“531”]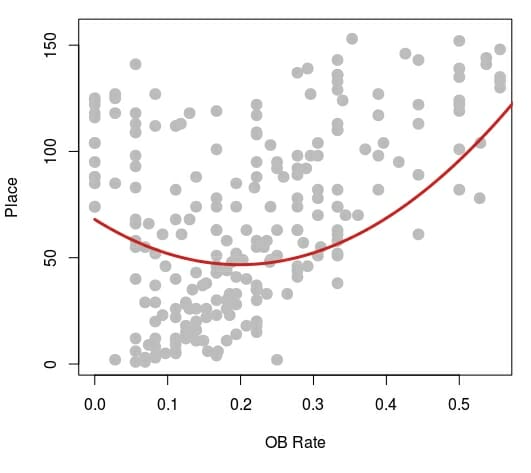 Plot of OB rate vs. place in the 2016 and 2017 Ledgestone Opens. The red line indicates the best fit line from a regression that includes OB rate, OB rate squared, and scrambling as explanatory variables.[/caption]
These results bring up a number of questions.
The first one that came to my mind was, doesn’t this pattern just mean that the best golfers throw OB a little bit but can just make up for it with quality scrambling? The answer to that question is certainly yes and no. Good golfers are good at scrambling. However, what I did not tell you before is that the models that produced the best fit lines shown in the two plots above actually control for scrambling. We won’t go into the math, but basically scrambling ability is held constant when I considered the relationships between OB rate and place.
A good example of this phenomenon is none other than Paul McBeth. He finished second in at Ledgestone last season with a very high .250 OB rate. How is that possible?
Well, it doesn’t just have to do with his scrambling. Let’s take a closer look at his play on the 4th hole at Lake Eureka (head to the footnote for cued up video). ((Video courtesy of Central Coast Disc Golf (rounds one, two, and four), and Jomez Productions (round three); McBeth each round on hole 4: McBeth, round one; McBeth, round two; McBeth, round three; McBeth, round four.)) This hole is a downhill par 3 at 423 feet with OB along the entire right side. McBeth twice, in rounds one and three, threw his drive OB and scored a 4. In round four he threw his drive off the fairway and was able to scramble for a par. This equates to a 33% scramble rate on this hole, which is well below the hole’s average for the tournament. Only in round two did he throw a quality drive that resulted in a very good birdie. He averaged a 3.25 on the hole, but without the birdie, he would have averaged 3.5, which is above the 3.37 value for the field. One way to interpret these results is that McBeth is playing on a razor-thin line between success and disaster, where potential OB, difficult scrambling scenarios, and bogeys are always in the mix!
What I think McBeth’s example and the relationship between OB rate and place indicates is the mental calculus that players go through on every hole in preparation for a tournament, in order to balance risk (throwing OB and perhaps carding a bogey) and reward (hitting a green and getting a good chance birdie). The players that reach their own equilibrium between throwing OB and hitting greens end up doing well. Those that gauge their ability to navigate the course ineffectively (or in other words, do the math wrong) or fall on either end of the razor-thin line (you pick your preferred metaphor), are either too risky or too risk averse and as a result do not score well.
So, while you are watching the coverage of the Ledgestone Open this weekend, pay attention not only to the decisions players make on the teepad each hole but how those decisions influence their OB rates and where they finish in the tournament.