Originally published at: https://discgolf.ultiworld.com/2022/08/03/adjusting-hole-scoring-averages-for-field-strength/
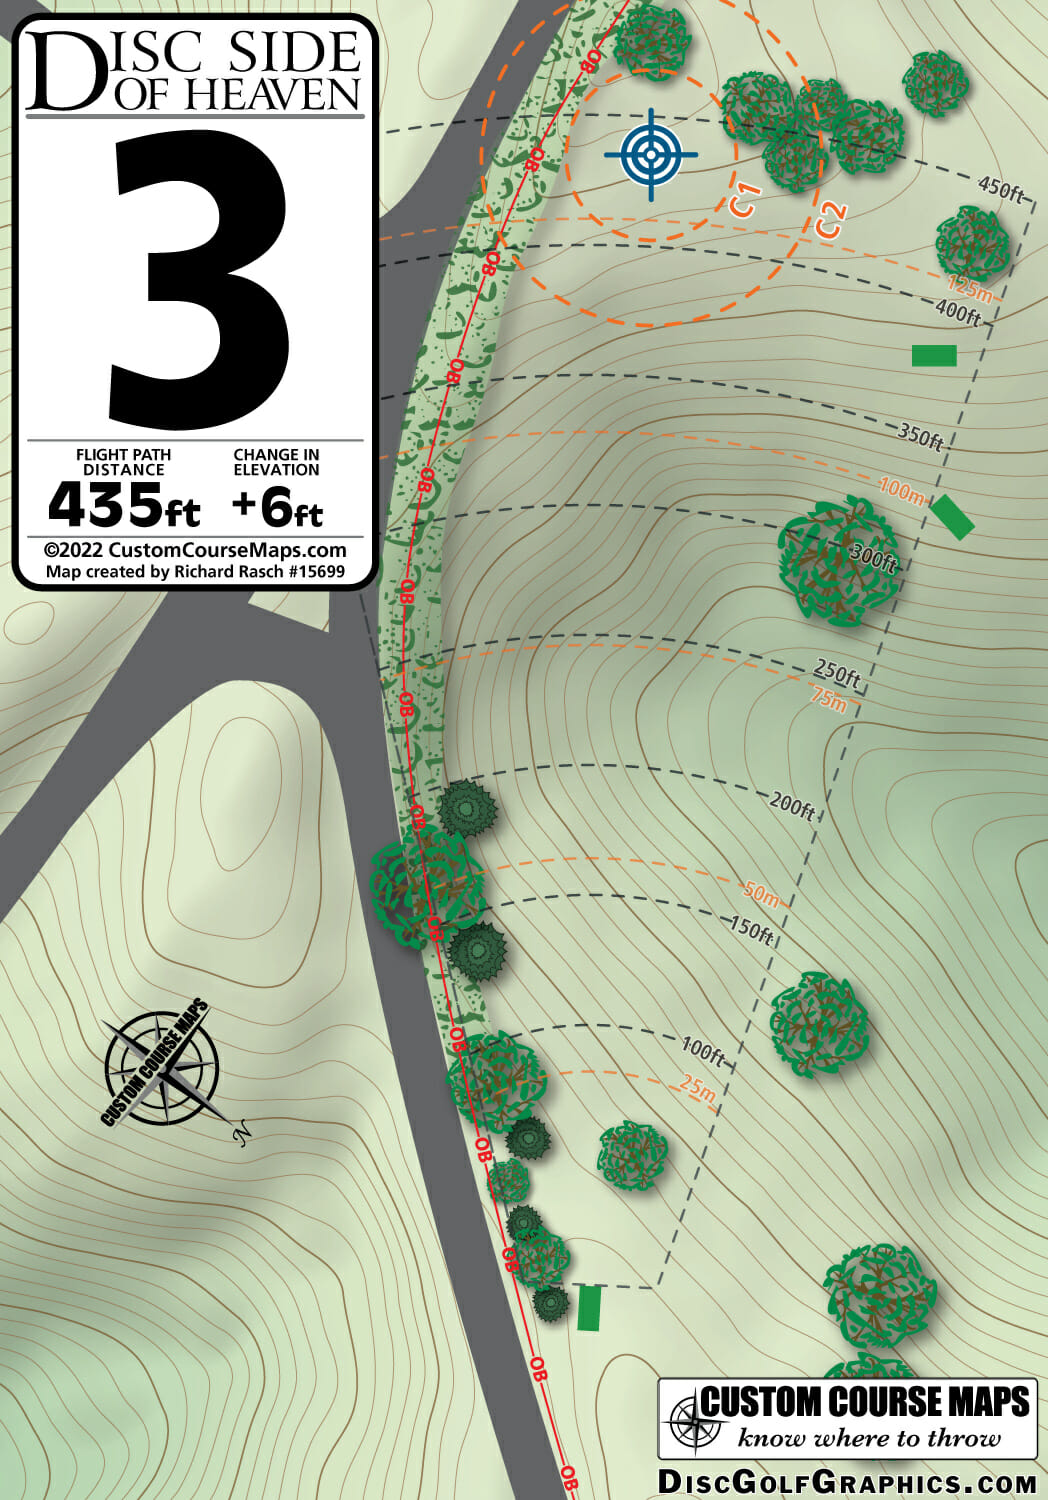
MPO Hole 3 at the Jonesboro Open is a mostly open 435 foot par 3 where a right hand back-hand (RHBH) player wants to flip up a disc and get it to move right with a little fade at the end of its flight.
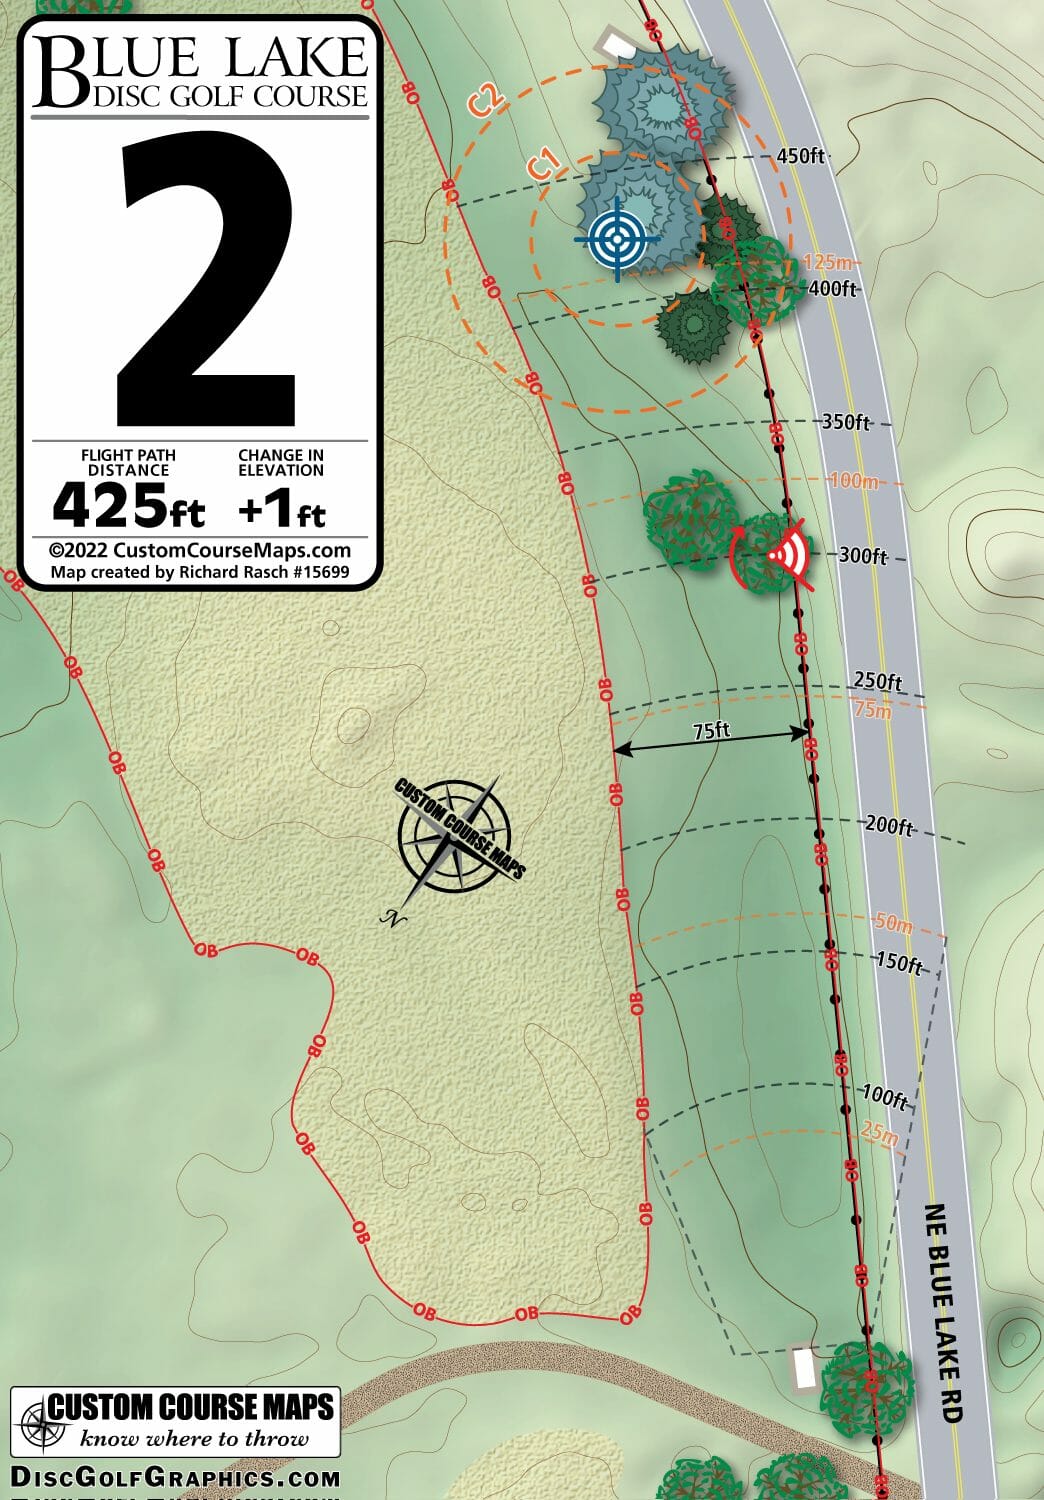
Hole 2 at the Portland Open’s Blue Lake course is a 425 foot mostly open par 3 requiring almost the same shot, but also allowing for a forehand hyzer. On both holes, the player cannot let the disc fade out too early — or flip too much — since both have OB well inside circle 2. But at Blue Lake, there is OB on both sides of circle 2, along with a mandatory on the right. That’s why it played 0.17 strokes harder on average.
But there is a problem with this analysis. The players in the field at the Portland Open are apples while the players at the Jonesboro Open are oranges. In order to accurately compare stats from different tournaments, we must control for field strength.
How do we control for field strength?
In my last article, I introduced the idea of competitive fields — or how many players at an event have a reasonable chance of taking down the win. If we look at Jonesboro and Portland Open together, the former had a competitive field of 41 players while the latter had just 30 competitive players. The Statmando field strength rankings agree with these trends: Jonesboro posted 76.48 points while Portland only had 55.14. The field at Portland was much weaker, meaning that we cannot compare holes between the two events without the hole averages getting biased by the field strength competing on said holes.
But it’s not as simple as just doing an adjustment multiple based on the comparative field strengths. We need to choose which players’ scores we include in the stats. Until then, we cannot compare holes between events. So which players scores should be included in hole averages?
My answer is that we should include the players who competed at a touring level on that particular weekend. If the player who finished 100th took a double-bogey, that doesn’t mean the hole was challenging. It means that a player who was not performing at a competitive level that weekend scored badly on a hole designed for touring-level players. But if a player who finishes 10th takes a double-bogey, it means that the hole was challenging even to players who came out to compete that weekend.
If we want a clear picture of how touring level players attack a course, then we don’t want averages that reflect the performance of the players who showed up. We need averages that reflect the performance of players who showed up to compete. Those who finish within the competitive field are the players whose stats we should be analyzing. At the Portland Open, we should be looking at the hole averages for the top 30 finishers, while at Jonesboro we should average the scores for the top 41 competitors.
By adjusting for field strength, we are no longer comparing fields that are apples and oranges, but comparing fields of the same strength that represent how competitive players attack the course.
Comparing Competitive Averages
Having now adjusted the hole averages for the competitive field strength, we can return to our example of the two similar holes. The competitive average for Jonesboro Hole 3 was 2.67, while the competitive average for Blue Lake Hole 2 was 2.75.
[table id=240 /]
There is still a difference in how the two holes played (0.08), which we would expect from Hole 3 of Jonesboro having no mandatory or OB on the right. It’s a small difference which allows players to pitch up for a par if they flipped their disc too much.
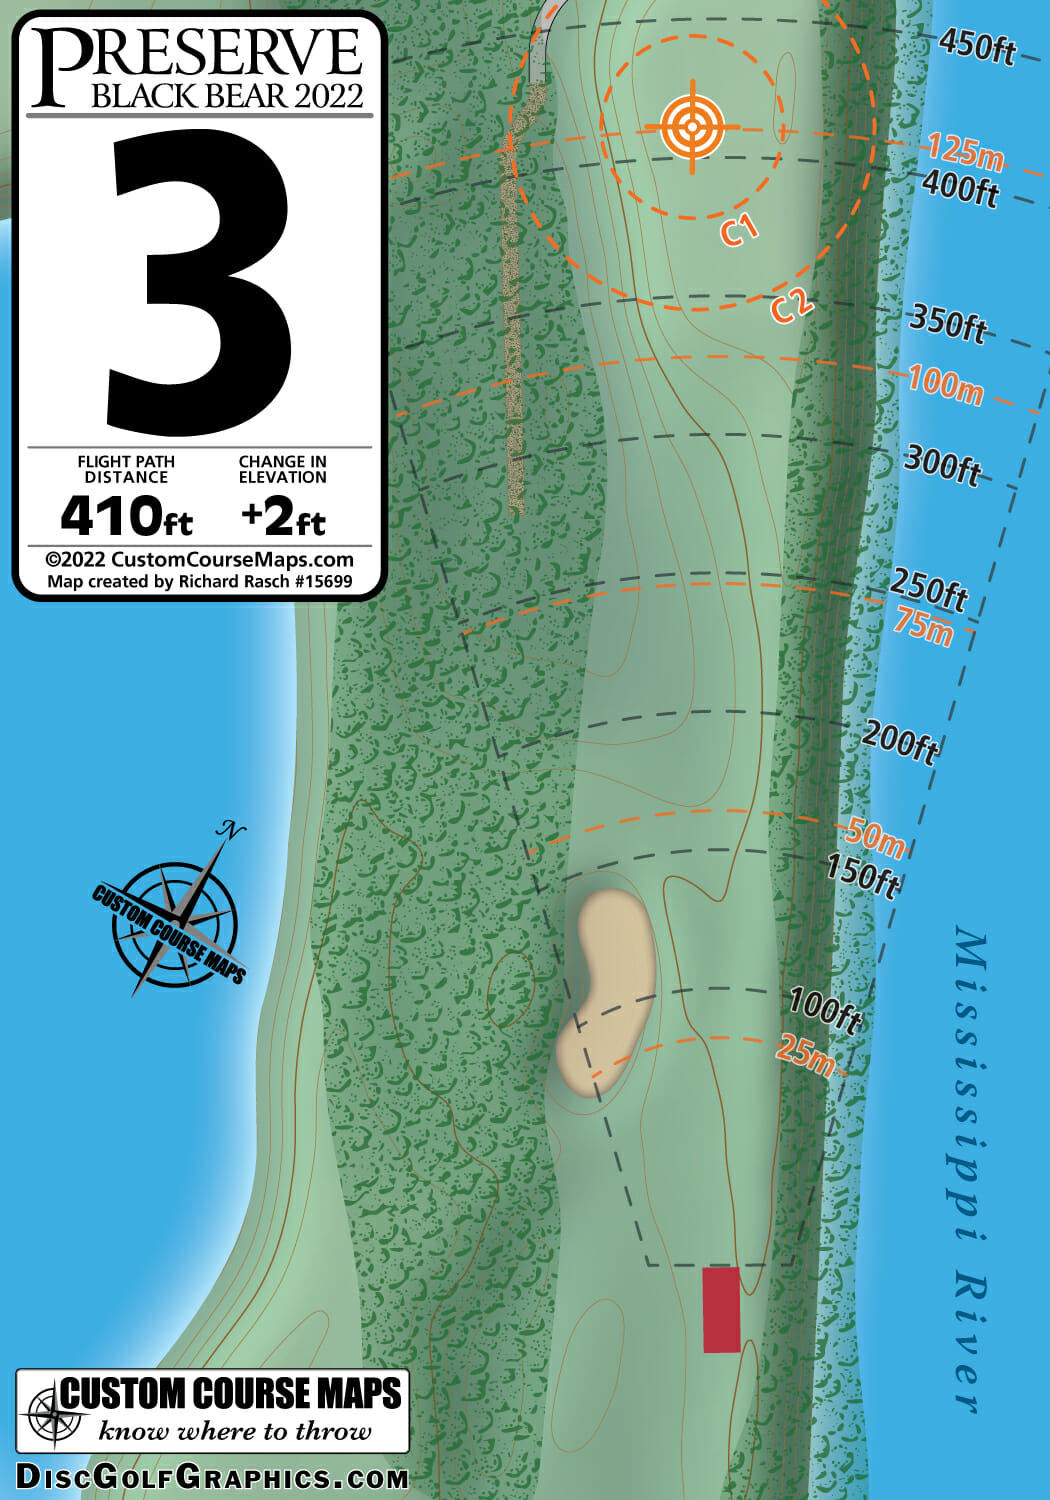
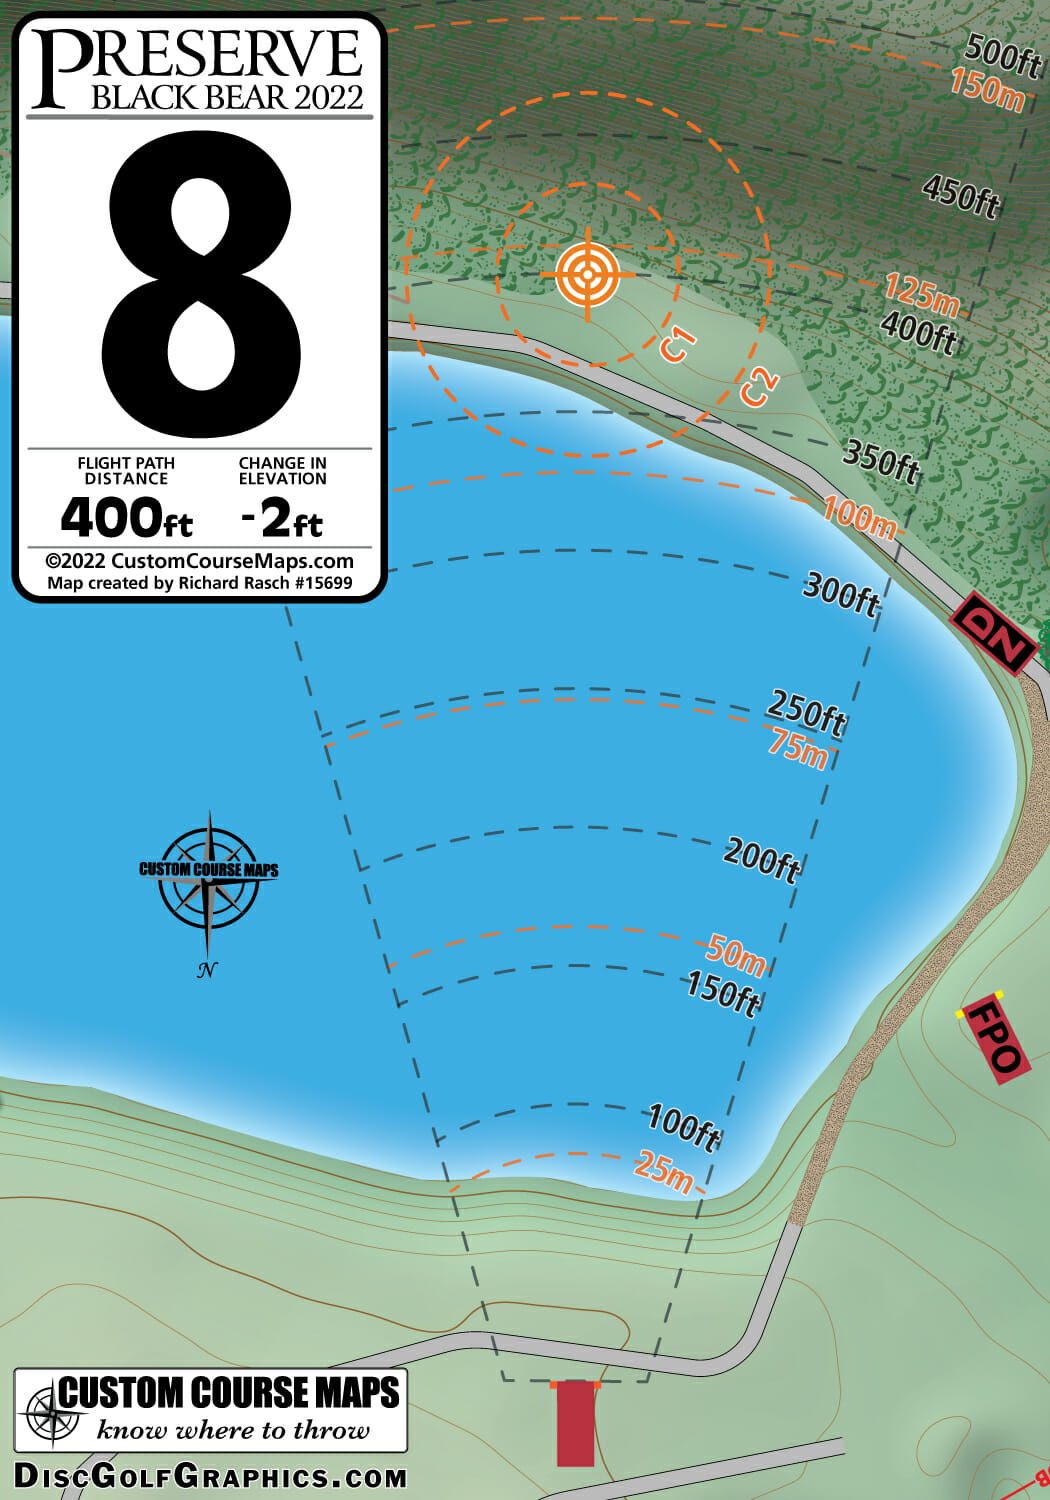
Where do we see big differences? The Preserve last weekend is a prime example. There were three holes relatively similar to the two we’ve already looked at. Hole 3 is a mostly open 408 foot par 3, where a RHBH player wants to flip up a disc and get it to move right, with a little fade at the end. It too has OB on the left side of C2, with a slope that skips discs towards the line. But the combination of the hole being 15-25 feet shorter than the previous holes allowed a few more players to get birdie. This gave the hole a competitive average of 2.59, 0.08 lower than Jonesboro Hole 3 and 0.16 lower than Blue Lake Hole 2. A takeaway: even 20 feet of distance on a hole matters.Hole 8 at the Preserve is a mostly open 406 foot par 3 that allows RHBH players to throw hyzers as long as they swing back in before the first tree on the right. The only danger of taking bogey on the hole is if players leave their drive short, since the entire drive is over water. Despite the green being quite wooded, making putting far more difficult, opening up the hyzer option makes hole 8 play much easier than the others we’ve discussed. It has a competitive average of 2.44, over half a stroke under par! Clearly, allowing a RHBH hyzer majorly dropped the average, despite the drive being completely over OB and the putting green being more challenging. A takeaway: if players consistently put themselves close to the pin, any danger on the hole is irrelevant.
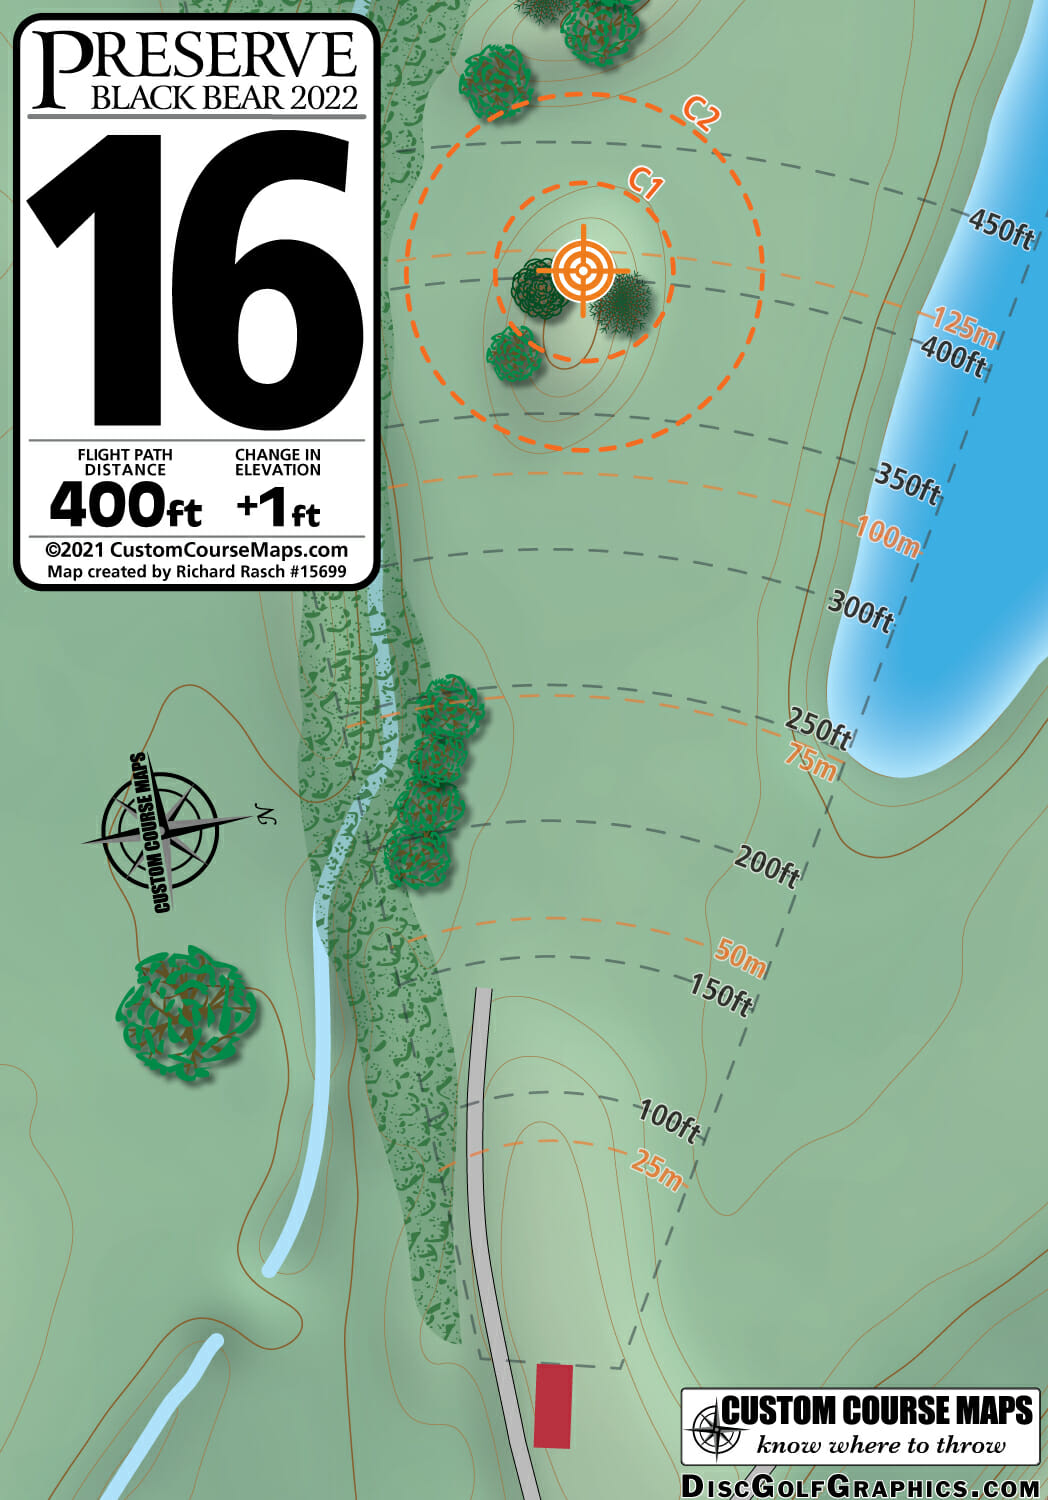
The final hole at the Preserve which fits the same mold is hole 16. It is a mostly open 402 foot par 3 with no confining OB, which encourages RHBH players to either throw a hyzer and skip their disc up onto the mounded green or to throw directly at the basket and slow their disc by hitting the top of the mound. But unlike Hole 8, Hole 16 has an average of 2.67. Why does it play so difficult if it allows a stock hyzer? My first thought was that the ripping headwind in round 3 caused the average to spike, but the first 2 rounds averaged 2.66 and 2.62, with a small jump to 2.72 in the final round. The difficulty did not come from wind on the drive.
While hole 16 does allow hyzers, it does not allow players to land close to the basket. It forces players to putt from 20+ feet away. And while if players miss an obstructed putt on hole 8 they have a tap in for par, if players miss on the mound on 16 they often have a 20+ foot comebacker. A takeaway: It doesn’t matter if the drive is a stock hyzer. What matters is if players can land close to the pin.
When controlling for field strength, we are able to accurately compare holes from different tournaments. We don’t need to worry if Ricky skips the event or if the bottom 20% of the field is rated under 950. By using the competitive average of a hole, we get a much clearer picture of the nuances of course design and how touring level players attack the course.

