[caption id=“attachment_49578” align=“aligncenter” width=“1342”]
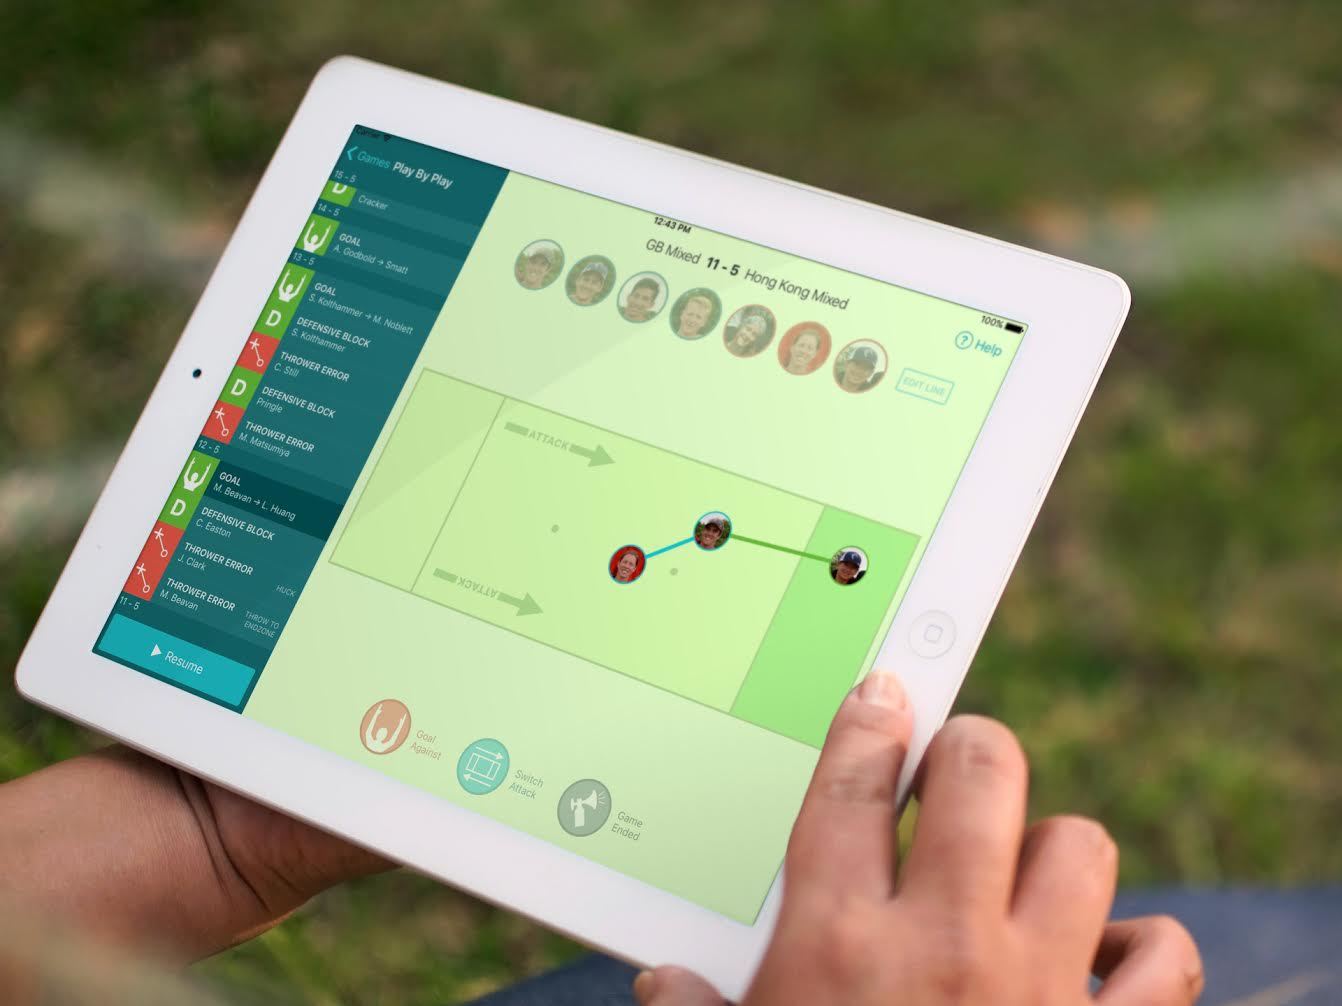
The Statto iPad app.[/caption]This article, written by Sam Rayner, is sponsored by the new Statto app, available for iPad and, soon, iPhone.
A few weeks ago, I released an ultimate stat tracking app. It’s called Statto and is available to download free from the App Store for iPad and, soon, iPhone. The same day, Sion "Brummie" Scone published his article on basic team analysis using four metrics. It’s a great primer on how busy coaches can get a statistical insight into their team’s performance without being too distracted from the game.
I agree with Brummie that coaches should watch the field as much as possible. But if you have the luxury of a second pair of eyes on the sideline--be it an assistant coach, injured player or helpful supporter--taking your stats to the next level might be less work than you think.
There are two keys to going from basic team-level stats to location-based, real-time player-level stats: using a tool designed for the job and tracking touches.
Upgrade From Pen And Paper
It’s cheap and versatile, but there are a lot of downsides to hand-writing stats beyond paper blowing away in the wind. Typing up everything into a spreadsheet once you get home is tedious. I’m ashamed to say muddy stat sheets have lain on my desk for weeks following a tournament, the data yearning to be analysed.
More important than duplicated effort is the wasted opportunity to gain insights mid-tournament. Statto produces box-scores, charts, and heat maps in real-time so you can make informed strategic decisions in those long gaps between games or even during half-time.
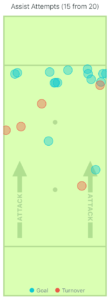
[caption id=“attachment_49580” align=“alignright” width=“200”] Statto Heat Map.[/caption]
Using an app also means things can be automated. For instance, Brummie suggests writing the score and whether your team is on O or D each point. Instead, dragging a line to the end zone on a virtual pitch is enough for Statto to auto-update the score and work out that we’re on D next point, not to mention recording the location, direction, and distance of the assist.
In fact, assuming touches have been recorded, that’s all that’s required to credit the thrower and scorer too!
Touches As The Foundation Of More Detailed Stats
The extra effort required for advanced analysis really comes down to keeping track of who is on pitch and the passes between them. It’s not enough to only record “stat-worthy” plays as they need to be put into context. For instance, a pass completion percentage is much more useful than simply knowing the number of turnovers.
Coaches are already tasked with managing pitch time and, from my experience, it’s a harder job than tracking stats. As it’s being done anyway, it makes sense to combine the two tasks into a single tool. Statto lets you reorder and filter players to ease line calling and there are features in the works for grouping players into predefined lines or by their particular strengths.
For their research paper accepted to MIT’s Sloan Conference, Ultiworld’s Sean Childers and Jeremy Weiss used UltiApps to draw every pass on the pitch. While this allowed for some really interesting analysis, such as measuring Involvement Yardage for players, Childers explained that “teams liked our analysis but found collecting and inputting the data was too onerous to justify the time investment."
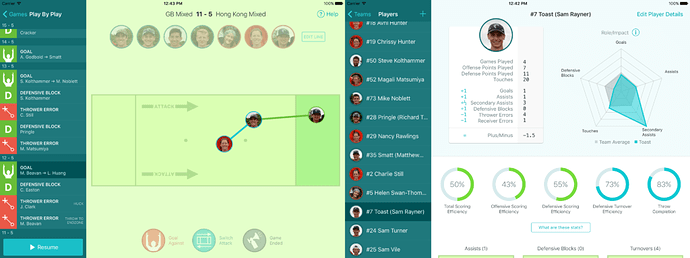
If we already know who is on the pitch, we can glean a lot by simply tapping the player whenever they touch the disc. No need to draw every pass - with basic touch data we can infer passes and expand on Brummie’s meaningful team metrics as well as analyze them at the player level. Statto does all the calculations for you.
Scoring Efficiency
Similar to Brummie’s suggested Conversion Rate, Scoring Efficiency measures the percentage of points/possessions scored. In addition to the team as a whole, we can measure total, offensive, and defensive scoring efficiencies for individuals as a percentage of points scored when they were on the line. This is a glimpse at the potential of this player-level data to provide measures such as Wins Above Replacement given a large enough data set.
First Possession Scoring Efficiency
As well as toggling between scoring efficiency per point and per possession you can select First Possession to see a percentage of points scored without turning over, a.k.a. the team’s Perfect Conversion Rate.
Recovery
I stole this idea wholesale from Brummie for inclusion in a recent update. As he says, it's a really useful measure of grit and determination!
Pass Completion
The percentage of passes that reached their target and were caught. It’s easy to distinguish between a thrower error and receiver error in Statto so a thrower won’t unfairly share the blame for a fumbled clap catch by a showboating receiver. Pass counts are calculated from total touches by subtracting those that don’t precede a pass (i.e. those that are a goal or precede a turnover or stall out). The completion percentage can then be calculated as passes - turnovers / passes.
Defensive Turnover Efficiency
The percentage of defense points where the opposition turned over at least once. Brummie refers to this as Successful Defensive Rate. Statto distinguishes between blocks attributed to a single player vs opposition turns that are unforced or due to team pressure so, rather than using blocks, Defensive Turnover Efficiency is calculated as number of defensive points where your team touched the disc at least once. We can measure this for an individual by considering only D points where they are on the line.
Of course, all of the useful team analysis Brummie suggests and much more can be done on the raw data Statto makes available to export. No more typing it all up when you get home! As well as the above, Statto offers real-time heat maps of assists, turnovers, and blocks as well as game timelines and graphs of player impact relative to their teammates.
Escaping “The Dark Ages Of Analytics”
Carl Bialik’s FiveThirtyEight article gave me the push I needed to work on a stat tracking app. It lamented the lack of money in ultimate compared to more mainstream sports:
Coaches — including my FiveThirtyEight colleague Jody Avirgan, an assistant coach for the U.S. men’s team — carried clipboards to log who played each point, with paper flapping in the wind and ink blurring in the rain. Players got a glimpse of what wealth can bring to a sport every time they walked past one of Watford FC’s brand-new 500,000 pound ($750,000) fields, but rope fences made clear that the Premier League team’s training ground was off-limits — as were stats as advanced and sophisticated as the EPL’s.
RELATED: Five Thirty Eight Dives Deep On Lack Of Analytics In Ultimate
Even at the elite level it will probably be many years before we can afford GPS tracking systems that tell us exactly where a player is at all times. But until then, the technology to collect more detailed data is already available to coaches around the world and, at a couple of hundred dollars for an iPad, within the price range of a lot of teams. With so many enthusiastic, helpful, or (unfortunately) injured spectators on our sidelines, we don’t need to settle for what a frazzled coach can scribble down if the tools are intuitive enough for anyone to use.
Statto is an attempt to bridge the gap until this data doesn’t need to be collected manually. But even when the pro leagues have cameras tracking every inch of the field, there will always be teams at the grassroots who can benefit from deeper insights with the tech they have.
You can download Statto for iPad free from the App Store. Keep an eye on Facebook and Twitter for updates and news on the iPhone release.
Originally published at: https://ultiworld.com/2016/11/22/advanced-stat-tracking-now-possible-statto-app/


