Originally published at: https://discgolf.ultiworld.com/2021/02/24/introducing-a-model-to-predict-top-finishers-at-pdga-elite-series-events/
The joy of professional sports is witnessing athletic excellence and deluding yourself, even if just for a moment, that you could do that. If only you had taken a slightly different path through life, you too would be leading your team to the playoffs. But you didn’t take that path, so you are at home on the couch loudly guessing who is going to win.
The desire to do a better job at predicting winners has driven the development of many sophisticated statistical models in most sports. The oddsmakers in Las Vegas are so good at predicting winners, and thousands of other outcomes across pretty much every professional sport, that they are willing to wager huge amounts of money that they are right. But one corner of the professional sports world that has not yet been fully quantified is disc golf. The writers at Ultiworld, our collaborator Aaron Howard among them, as well as the team at UDisc, have made substantial progress on the topic. But the field is very much still in its nascent days. In this article, we attempt to advance the field by introducing a new model to predict winners at Elite Series events. This model draws on the work done by prior researchers and introduces new predictive mechanisms.
Disc golf, like golf, is a sport of precision. Rarely is the difference between first and second place at an elite tournament more than a few strokes. This makes it very difficult to predict who will win at any given tournament. Paul McBeth could be having a great event, but then one errant thought about how much an oil change on a McLaren costs could send a drive out of bounds and cost him the first place finish. Holly Finley’s time spent practicing in Wisconsin winters might be just the edge she needs to triumph at an abnormally cold tournament.
The ways in which an otherwise favorite might fail, or a relative unknown might succeed, are myriad. With better data or more analytical skill, it may very well be possible to predict the outright winner at an event, but in data science, as in disc golf, we are amateurs, so that task is left to future researchers. Instead, we reframe the problem. We focus on predicting who will finish in the top five at a tournament. By expanding our target area beyond just the first place finisher, we average out some of the variation that makes predicting the actual winner difficult.
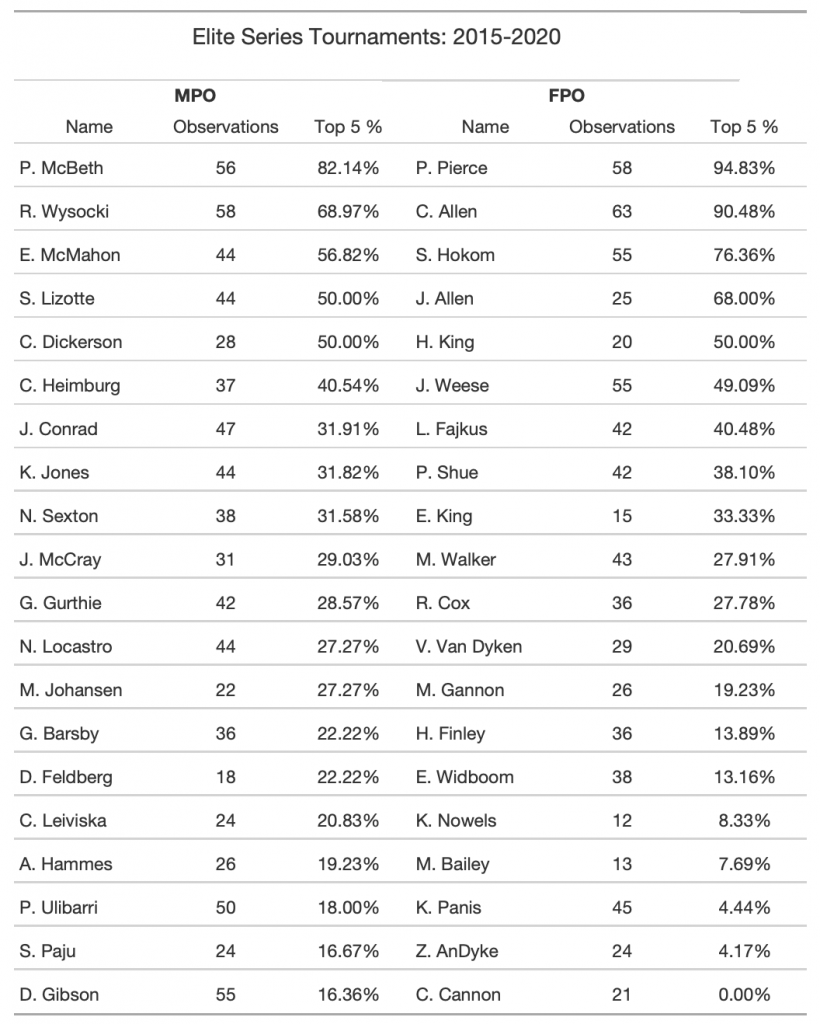
We developed our model using Elite Series events from 2015 through 2020. The table below shows the 20 MPO and FPO players who have played in at least ten Elite Series events since 2015 ordered by the percentage of events in which they finished in the top five.
The dominance is clear. There are a handful of players who are consistently in the top five. The MPO side shows slightly less clustering at the top than the FPO side, but not dramatically so. The top ten MPO players account for 66% of all top five finishes while the top ten FPO players account for 81%. This is an almost unbelievable concentration of talent. Said differently, of all top five finishing spots at all Elite Series events over the past five years, more than eight out of ten were filled by the first ten women in the table. That’s an astounding result that provides context for development of our model.
With this distribution in mind, we now embark on the task of building a model that can predict top five five finishes based solely on data knowable prior to the tournament. An obvious choice for modeling a binary dependent variable is a logistic regression model.1 The math is more complicated, but the basic idea is that, given a set of input factors (independent variables), a logistic regression model outputs a value between zero and one that is the the probability that the dependent variable would have the value one. In this instance it means the model will output a probability that a player finishes in the top five at a tournament.2
To develop the model, we need a data set of past performance. To construct our training data, we compile a list of every player and their finishing place at each Elite Series event since 2015. The Elite Series is a set of professional disc golf’s premier events. It is designed to highlight the skill and legitimacy of the sport. These are the events that you will see covered on Jomez and, if anyone actually stood around the water cooler at the office talking about disc golf, these are the tournaments they would discuss. They are well-organized and attended by most of the top pros. The list of events has evolved over time, but many of them are played year over year. You can find a full list of the 72 events we considered on the PDGA website.3
When choosing input factors, we focused on including as many explanatory variables as our sample size would permit. As anyone who has played disc golf knows, one of the biggest determinants of performance is weather. Further, not every player is impacted by the weather in the same way. You might be just fine in the rain but buckle once the wind kicks up, and I could be just the opposite (Although, in reality, I assure you I am terrible in both). To that end, we include maximum/minimum temperature, wind speed, and precipitation in our model. To control for the player’s measurable skill, we include each player’s most recent PDGA rating prior to the tournament. The ratings update each month, so they are always pretty fresh.
Researchers in other sports have found an inverse relationship between distance traveled to a tournament and performance: teams that have to travel long distances to play tend to play worse. Therefore, we include distance from hometown to tournament as an input factor. Finally, we include a set of dummy variables for all players who have at least ten top five finishes in the data.4
There are two features we have not yet included in the model that we intend to explore in the future. The first is to account for how a player performs on a given course. It seems logical that a generally risk-averse playing style would be an asset on a course with a lot of out-of-bounds to contend with but a liability on a more forgiving layout. This is an important source of player-to-player variation that should be accounted for. Another variable we would like to include is a measure of momentum: how well has a given player done on the past few tournaments they played? Players go hot and cold, so it seems plausible that performance at recent tournaments is likely to have an impact on their level of play. Stay tuned in the coming weeks for updates to the model!
After all that preparation work, we have a model that can take in a whole slew of inputs and spit out the probability that a player lands in the top five at a given tournament. A natural next question to ask is: how important are each of the independent features in predicting top five finishes? To measure the relative importances of our various input variables, we construct what’s called a random forest classifier.5
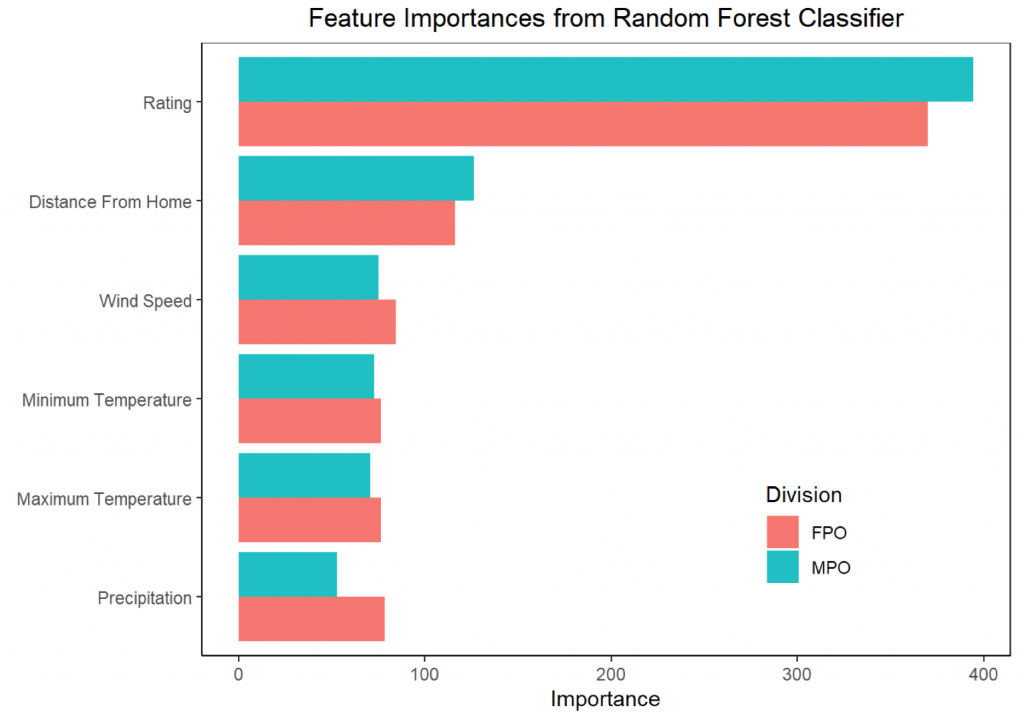
From the random forest model, we can estimate then estimate a metric known as Mean Decrease in Gini, which tells us how important each variable is at decreasing incorrect predictions. A higher value means that the given variable explains more of the variation in the dependent variable. The graph below shows the Mean Decrease in Gini (labeled as “Importance”) for each non-dummy feature in the model.
When we construct this model, unsurprisingly we find that PDGA rating is the most important factor in explaining top five finishes. The second most important factor is distance from home. While this is a result that has been found in other sports, the nature of pro disc golf makes it surprising that it should matter! Many pros are on the road full-time. One tournament leads to the next and then to the next. If pros aren’t going home between tournaments, why should it matter where their hometown is? One possible explanation is the familiarity factor. If you cut your teeth on East Coast wooded courses, it makes sense that you should perform better on those type of courses. Further, beyond just the course-type familiarity, it is likely that you have played many of the high-caliber courses near to you that host Elite Series events. There is of course a good amount of noise in the data. The top five is dominated by a small subset of players, so it is also possible that the result we are seeing is due to noise.
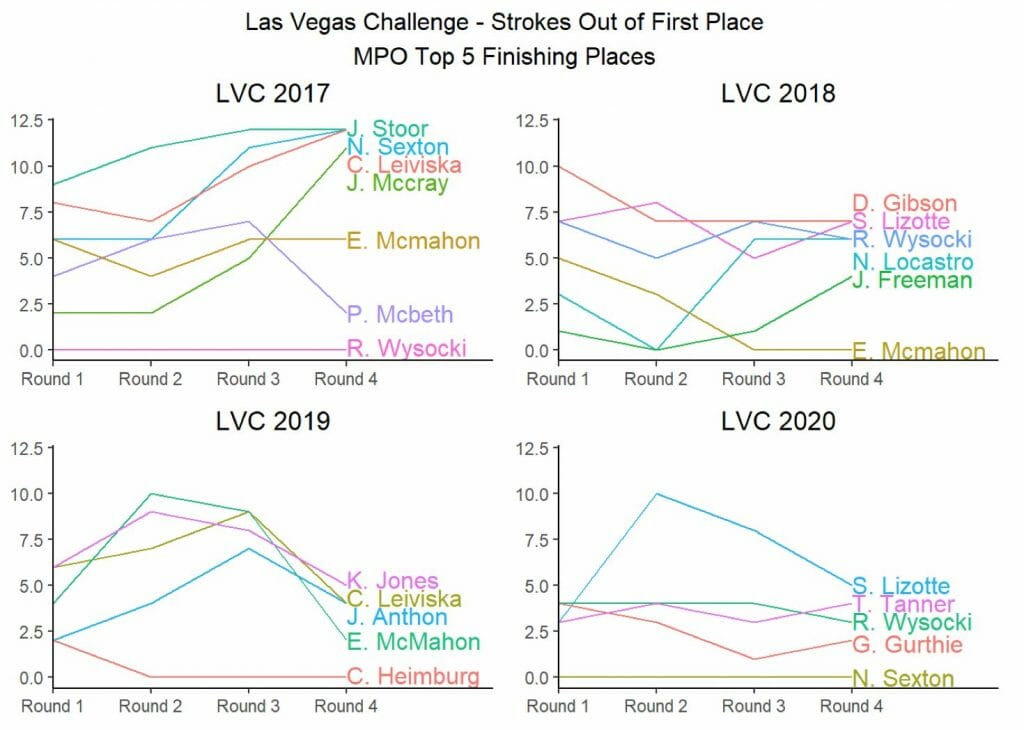
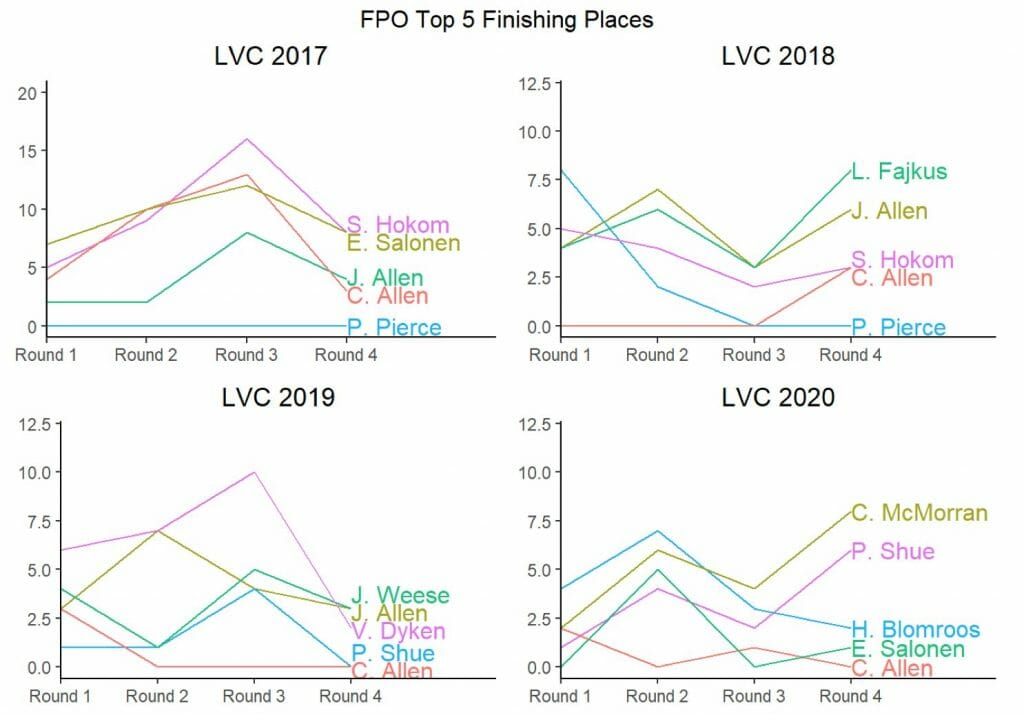
To stake our claim as disc golf analysts, we intend to publish predictions ahead of each Elite Series event this year. We will produce our predicted top five as well as five additional “honorable mentions” that our model predicts still have a good chance at making the top five. While we don’t entertain that the model will be perfect at any given tournament, we believe that over the long run it will be successful. The first stop on the Elite Series tour is the Las Vegas Challenge, which starts tomorrow. The graphics below show the winners of the past four Las Vegas Challenges and their route to the win (being lower on the graphs is better):
Over the past four years, the MPO top five has been filled with names you would expect: Ricky, Eagle, Simon, and Cale all show up more than once. Notably absent from that list? Paul McBeth. While he did not play the event in 2020, he has only finished in the top five once in the past four years, which is substantially below his average for all Elite Series events. But our model predicts that this relative underperformance is only a blip on the radar.
On the MPO side, for the 2021 Las Vegas Challenge, our predicted top five is the following:
- Paul McBeth, Ricky Wysocki, Calvin Heimburg, Eagle McMahon, and James Conrad
Honorable mention goes to Kevin Jones, Nate Sexton, Garrett Gurthie, Zackeriath Johnson, and Ben Callaway.
Another interesting takeaway is that there hasn’t been much change in the lead at the Las Vegas Challenge. In two of the past four years, the leader after round one wound up winning the tournament. And in three of the past four years the leader after two rounds took home the trophy. This year, look for early leaders to keep their place at the front of the pack.
The story of the FPO side in Las Vegas has been of two names: Paige Pierce and Catrina Allen. With two wins for Pierce and one (nearly two) for Allen over the past four years, these two have solidified their dominance over the event. In the final round in 2017, Allen fell just short of stealing the win from Pierce, making up ten strokes in the final round. The next year, Pierce found herself eight strokes out of the lead after the first round. She worked her way back to a tie with Allen after three rounds and held on for the win. Allen continued the pressure as she was just edged out in a playoff in 2019 and claimed the solo first place in 2020 (Pierce did not play).
For 2021, our model predicts the top five Las Vegas Challenge finishers as:
- Paige Pierce, Catrina Allen, Sarah Hokom, Jennifer Allen, and Jessica Weese
The honorable mention category includes: Lisa Fajkus, Madison Walker, Rebecca Cox, Hailey King, and Valerie Mandujano.
Don’t sleep on the FPO in Las Vegas, if recent history is any guide, we are in for a wild ride!
Certainly, we are interested in more than just making predictions, we want to put them to the test. To benchmark the performance of the model, we need human experts to compare to. Paul Bunyan raced the mechanical saw. John Henry faced off against the steam-powered drilling machine. Garry Kasparov matched wits with Deep Blue. In this next iteration of the fabled man vs. machine tradition, we challenge the brain trust at The Upshot. Over the course of the 19 Elite Series events in 2021, can Charlie and his co-host beat our model? Is it bad business to publicly challenge the owner of the website publishing your article? Only time will tell.
A logistic regression model is far from the only way to model a binary dependent variable. We tested our input data on a number of common methods, including linear discriminant analysis and k-neighbors. We found that logistic regression yielded the best results for this data specification, but the choice of model is an obvious place for future research. ↩
If you are interested in learning more about the mechanics of a logistic regression model, the Wikipedia page is informative. ↩
That dataset is restricted to the top 100 male and 100 female players based on their 2019 PDGA ratings. By cutting down the list of players, we are building a dataset with less imbalance in the dependent variable. Imbalance occurs when you have a dataset with a lot of one value of the dependent variable and not much of the other. In this case, we have a lot of instances of players not finishing in the top five and not many of them finishing in the top five. While you do occasionally see a player from outside the top 100 finish in the top five at a tournament, it is very rare. On the MPO side, we end up with a dataset at the player/tournament level of 2164 observations and for FPO we have 1098 observations. ↩
We include dummies for only those players who have at least ten top 5 finishes to ensure that the model has sufficient training data. On a technical note, we standardize each of the features to limit the impact of outlier values. ↩
At a high level, a random forest classifier will estimate a bunch of different decision trees on your training data and then take the most common predicted class from those decision trees as its predictions. Think of a decision tree like driving to a new course when you don’t know the way. If you make it in time, you will get to play with your friends (analogous to finishing in the top five in our model). If not, they tee off without you and you are playing alone. On your drive there, at each intersection you can either turn left or right and continue that process until you either make it to the course or not. Each week, you drive to the course and each week you try a different route. Eventually, you will have tried every possible combination of routes and will know the outcome of each. If you wrote it all down, this would be your decision tree. ↩


