
[caption id=“attachment_48943” align=“aligncenter” width=“800”]
Harvard coach Mike Mackenzie keeping stats at the 2016 College Championships. Photo: Kevin Leclaire – UltiPhotos.com[/caption]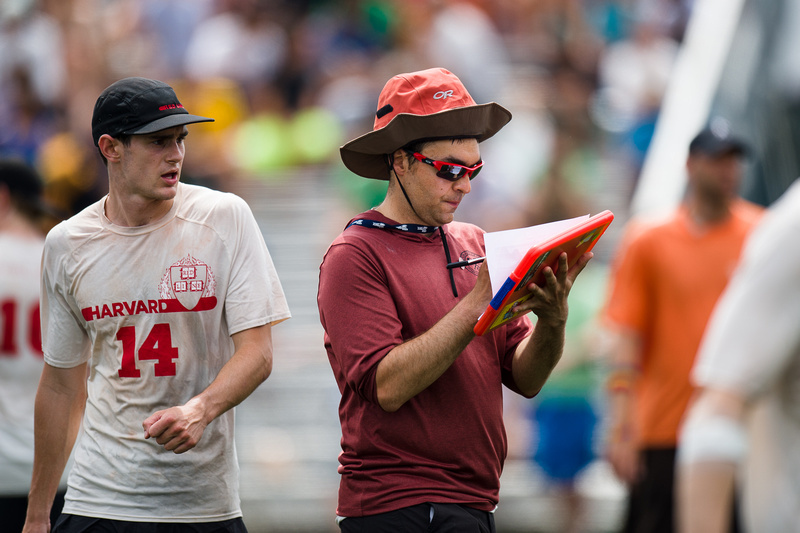
This article is presented by Spin Ultimate; all opinions are those of the author. Please support the brands that make Ultiworld possible and shop at Spin Ultimate!
Everyone would like to know more about their team’s strengths and weaknesses though objective statistical analysis. But data capture is difficult and time-consuming and the current stats tracked in ultimate are woefully inadequate for measuring effectiveness.
Other, smarter people than I have written on this subject before. My thinking is generally along the lines of Brett Matzuka’s, in that individual statistics are more of a distraction than an aid to a coach. But if you don’t have anything more than pen and paper on the sideline, you’re not going to be generating heat maps any time soon. Some other metrics such as “niceness” or even how good a pull is, are far too subjective to provide a consistent and repeatable set of results.
So, what simple, objective statistics are useful for a coach, and can be collected with a minimum of effort on the sideline?
Before we can even evaluate what is useful, we first need to focus on the raw data collection. Keep it simple. Here’s what I capture:
- Score: This is just the game score at the start of the point. Useful for tracking game progress and making sure you don't miss any points!
- O or D?: How are you starting this point? Allows you to split your stats by line if you have different units.
- Blocks: Any turnovers generated by this line, regardless of how they occurred.
- Turnovers: Any turnovers committed by this line, regardless of how they occurred.
[caption id=“attachment_46845” align=“aligncenter” width=“171”]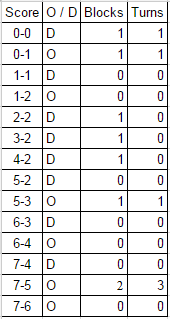 Raw data for half a game[/caption]
As you can see, the raw data capture process is very simple and can be easily performed without distracting the coach from their main tasks of calling lines, managing strategy, or feeding information to players on the field.
Raw Data Into Meaningful Metrics
At the end of the game, you're then able to use the raw data to count the following:No Turn Goals
What does it mean? Goals scored without turning the disc over Why is it important? Scoring without turning over is what every team should be aiming for. It can be incredibly frustrating for a defense to never get the disc from an O-line, and if your D-line can score without turning over then this quickly builds pressure on an opponent's offense, who will be nervous that any time they make a mistake, it will be punished with a break.Had Disc Points
What does it mean? The number of points in which your team had possession. For O, it's the same as the 'Points Played'; for points where you started on D, it's any point in which you got a block. Why is it important? This establishes a baseline for our offensive efficiency, especially on D points, as it marks the maximum number of breaks you could have generated if you scored in every point where you generate a block.You should now be able to produce a table like this for both O line and D line:
- Points Played
- Blocks
- Turnovers
- No Turn Goals
- Had Disc Points
- Breaks: For the O line, this is the number of points played that they failed to score. For the D line, it's the number of goals they scored.
Goals with Turns
What does it mean? Goals scored despite turning the disc over at least once during that point. How is it calculated? Goals Scored - No Turn Goals Why is it important? Sloppy points happen. But can we grit out the messy points? For the offense, it tells us about the O-line's defensive ability, which is not otherwise captured.Conversion Rate
What does it mean? Percentage of points where we had the disc that we scored. How is it calculated? For offense, this is (Points Played - Breaks) / Had Disc Points. For defense, it is Breaks / Had Disc Points Why is it important? A simple measure of our offensive efficiency; the higher, the better. Dividing by Had Disc Points rather than Points Played ensures a fair reflection on the D-line's offensive skills, rather than their ability to generate turns.Perfect Conversion Rate
What does it mean? Percentage of the points where we had the disc that were scored without any turnovers How is it calculated? No Turn Points / Had Disc Points Why is it important? Scoring goals without turning over is the gold standard.Mean Turns per Point
What does it mean? The average number of turnovers per point in which we had the disc How is it calculated? Turnovers / Had Disc Points Why is it important? Total turnovers doesn't always tell the whole story, especially for a D-line that might not always get a chance to play offense. It is useful to compare this statistic across multiple games as a measure of the strength of the opposing team's defense -- or the effects of weather!Recovery
What does it mean? This is a measure of a team's ability to score goals after already turning over. Only points in which we both had the disc and a turnover are counted. How is it calculated? Goals with Turns / (Had Disc Points - No Turn Goals) Why is it important? What happens when we turn over? How likely are we to get the disc back and score? Recovery is a measure of grit and determination.Successful Defensive Rate
What does it mean? The percentage of points where the D-line generated at least one turnover How is it calculated? Had Disc Points / Points Played (only count points started on D) Why is it important? It is important to differentiate how often the D-line generate turnovers from the likelihood of the D-line to convert into a goal. A high score here indicates that the D-line is playing good defense, so if they are not generating many Breaks then the focus should be on improving the D-line's offense.Telling A Story Through Statistics
These statistics can help to tell the story of what happened during a game, and what to prioritize as a coach. Let's look at some examples. First, the data, taken from six anonymized real games; white cells are raw data, orange are generated.[caption id=“mastersstats1.png” align=“aligncenter” width=“800”]
Sample Tournament Stats[/caption]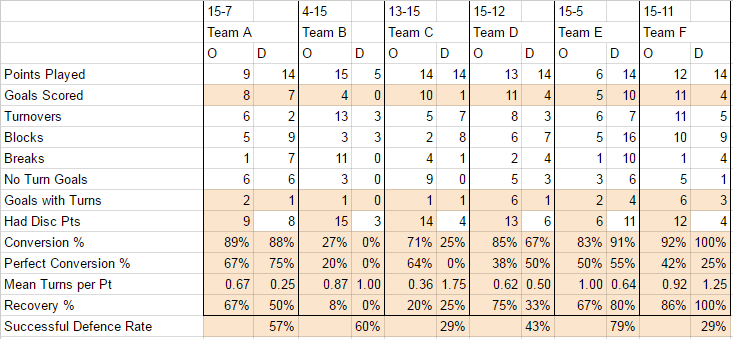
From here, we can learn how to extrapolate out the key takeaways from each game. Let’s look at some examples.
Strong defenders struggling to convert against high level opponents.
What does the data say? Game A was a comfortable victory, Game B a blow-out defeat. Yet look at the Successful Defense Rate and you'll see that the D-line was able to generate turnovers against both opponents at nearly the same rate (57% in Game A, 60% in Game B). What does this tell us? The D-line was able to get blocks against a much stronger opponent, but could not convert against the stronger Team B defense. What is the lesson? D-line offense needs to practice playing offense against stronger defense; reps of D-line vs D-line at the next practice might work well.Sloppy yet successful offense.
What does the data say? Comparing the Conversion Rate for the O-line in Game A (89%) with Game D (85%) would lead you to believe that they performed equally well in both games. The Perfect Conversion rate (67% vs 38%) tells another story. What does this tell us? In Game A, the O-line played nine points and scored six without turns. In Game D, they played 13 points but scored only five without turns. Recovery was similar (67% vs 75%) in both games too. Only by counting No Turn Goals can we see that the offense was sloppy in Game D. What is the lesson? Relying purely on whether the O-line was broken doesn't give a coach enough information about whether they were playing efficiently.Maintaining a tempo is important for offense.
What does the data say? Compare Mean Turns per Point for the D-line in Game C (0.36) vs Game E (1.00) and you'll see that, despite similar Conversion Rates, the O-line struggled more in Game E where they were winning easily (15-5 final score) than in Game C where teams traded most of the game (just one break for our D-line). What does this tell us? The O-line likes to find a tempo and stick to it. When the D-line goes on a roll, the O-line can get cold, and a lack of touches can lead to a poor performance. What is the lesson? The O-line must take responsibility for staying loose and maintaining focus when they are off the field for a long stretch.High quality offense despite losing.
What does the data say? Compare offensive Perfect Conversion in Game C (64%) vs Game D (38%), and also the Conversion Rate in Game C (71%) vs Game D (85%) for an accurate reflection of the two games; Game C saw higher quality offense, but an opponent we were unable to get the disc back from, while Game D saw more turnovers from both our O-line and their D-line. What does this tell us? Despite losing Game C, the O-line did a great job; their best of the tournament in fact. The difference between winning and losing in these games can be explained by looking at the D-line performance; in Game C, they were able to generate more blocks than in Game D but were only able to generate a single break against Team C compared to four breaks against Team D. What is the lesson? Losses are generally put down to a poor offensive performance. Here, the stats show that, on this occasion, the offense performed well despite losing.Defensive grit.
What does the data say? Compare Recovery for the D-line in Game D (33%) with Game F (100%). In both games, the D generated the same number of Breaks, but in Game D the D-line had the disc in six points compared to just four in Game F. What does this tell us? The defense was able to generate more turns in Game F, but those turnovers all happened in a small number of points. This means that, most of the time, our D-line was not able to get the disc off their offense. But when our D-line generated a turnover in Game F, they scored every single point. What is the lesson? Counting the total number of turnovers generated can be misleading. 10 turnovers in 10 points could lead to 10 breaks; 10 turnovers in one point can only ever lead to one break. While the D-line didn't play perfect offense, they did ensure that they did not waste a single opportunity to break, showing their ability to bounce back after making mistakes.Conclusions
By capturing a very small amount of data, you're able to reflect with some accuracy on the games afterwards. Hopefully, you'll be able to spot patterns across multiple results and use it as feedback into your coaching plan. Of course, capturing more data can allow you to split the data far better; marking whether your O-line are facing a zone defense, or when your D-line runs a fast break will allow for a more detailed analysis later. The possibilities are endless. For this article, I've tried to keep things as simple as possible to show the power that even some basic data capture has and how it can improve your coaching plans.Originally published at: https://ultiworld.com/2016/10/25/basic-team-analysis-using-four-metrics/