Originally published at: https://discgolf.ultiworld.com/2021/10/01/what-makes-a-good-disc-golf-hole-a-statistical-analysis-of-the-mvp-open/
Disc golf has clearly enjoyed a surge in popularity in recent years, but it’s hard to identify what factors have most driven this growth. We have seen large improvements in the media coverage, but that could easily be a consequence of disc golf’s growth rather than a cause. The same could be said of the development of new high-quality courses or increased money in the professional scene. The improvement of statistics and data collection, however, has almost certainly not been a major cause of this growth. I can’t imagine any new player would be drawn to disc golf because of data collected during professional tournaments. But for those of us already invested in the sport, statistics can truly enrich our playing and viewing experience.
UDisc has developed a suite of statistics that focus on each individual player, tracking fairways hit, scramble percentage, putting percentages, etc. Players now have massively more data available to them now than even a decade ago, but the data is only useful if it can be applied. I don’t know to what extent professional players have used these statistics to inform their practice or tournament play. Personally, I have found the statistics difficult to use strategically. When I track all my stats on UDisc, it only reveals that I am worse than the professionals in every statistical category. Thank you UDisc, I now have quantitative data of my own shortcomings, but I don’t know the best way to improve. I don’t know if I am better off working on my putting, developing a stronger forehand, increasing my distance, or practicing throws through tight gaps. Clearly improving any or all of those things would make me a better player, but I would like some basis on which to prioritize my efforts.
One perspective that may help answering some of these questions is switching the focus. Rather than track statistics for a single player through a tournament, instead we can look at the properties of a single hole. Some holes are naturally shaped to favor forehands or backhands, longer holes favor powerful throwers, and wooded holes favor players who can control their angles. The nature of the hole determines which skills are most important.
There would be no point in practicing rollers if you only played rocky courses where they can’t be thrown. Similarly, I don’t want to spend the time developing a grenade shot if I’m never in a situation where I would need it. Every hole on a disc golf course tests some set of skills, and I want to know which holes are most important to achieve a better score, and by extension, which skills are most important to develop.
One goal for a course designer is to develop holes that are skill testing, where better players will tend to succeed and worse players will tend to struggle. A designer has many tools to do this, designating OB, lengthening a hole, changing elevation, adding obstacles, etc. Each challenge requires a different skill to overcome. Even the most repetitive hyzer-fest courses around still bring some variety from hole to hole. Each individual hole will, then, be more or less successful at testing the skill of the players. For some holes, the best players will be able to prove themselves, and they will very likely to birdie or eagle while worse players bogey. For other holes, the range of possible outcomes will be compressed — the best players will separate themselves only slightly or maybe not at all.
At an extreme, if a hole is truly random, if the worst players are just as likely to succeed as the best, then that hole may as well not exist. Its outcome would not in any way predict the result of the tournament. That also means whatever skills such a hole requires would be less important to practice. If the best players score the same as the worst, then there is no value in improving.
So that brings us to Maple Hill.
Arguably more than any single course on tour, Maple Hill has a huge variety of hole types, requiring the largest variety of shots. A full round through Maple Hill will test the entire gambit of skills required to be a professional disc golfer. Maple Hill is sometimes described as a course full of signature holes, but even for one of the world’s most highly rated courses, it can’t possibly be true that every hole is equally important. Playing some holes successfully should have a strong bearing on the outcome of a tournament while other holes are less critical. After watching this year’s MVP Open, I wanted to know which holes most strongly determined the outcome. Focusing on those holes would give players a better sense of which skills to hone and perhaps give designers inspiration to build better courses.
Methods
The coefficient of determination (R2) is a common statistical test which quantifies the degree to which two variables are related. An R2 of 0 indicates that the chosen variables are entirely independent, a change in one does not in any way predict a change in the other. For example, if you rolled a dice before every hole of disc golf you played, the outcome of the dice roll should have no correlation with your score on the hole (R2 = 0). Conversely, an R2 of 1 indicates that the variables are directly correlated: one value can be predicted entirely by knowing the other. For example, if we measured the height of every professional disc golfer in inches, that height would correlate directly (R2 = 1) with their height in centimeters.
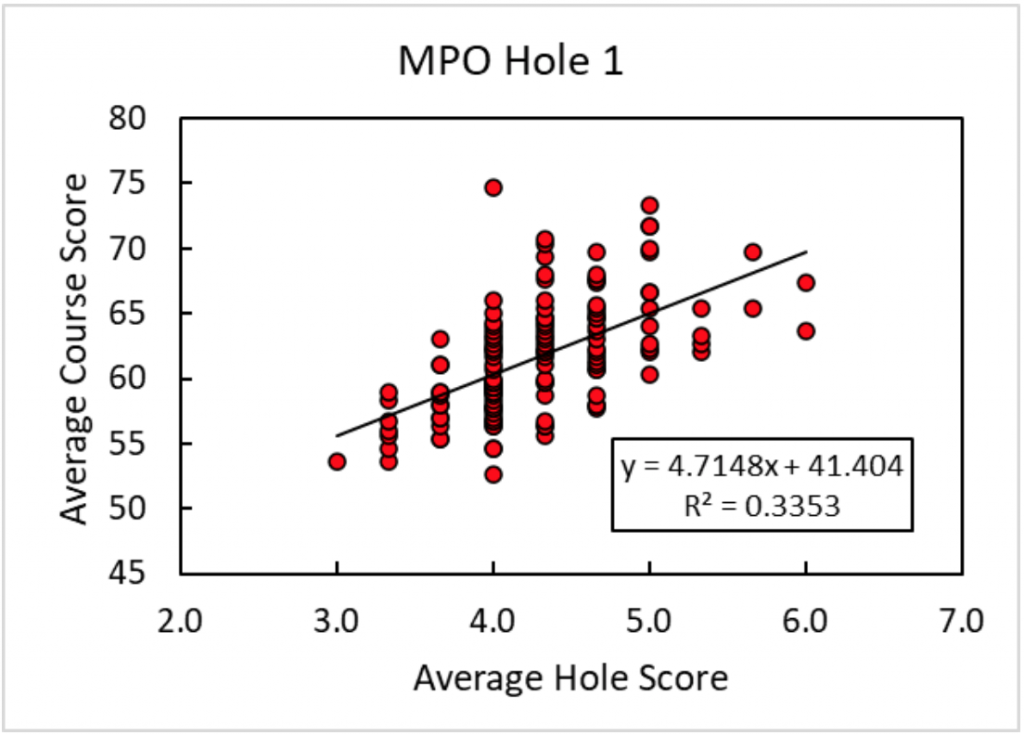
Every disc golf hole will have a distribution of scores reflecting how well each person played on average. For example, on hole 1 of the 2021 MVP Open, only Eagle McMahon birdied all three rounds, giving him an average score of 3. Seven players averaged 3.33, thirteen players averaged 3.67, etc. Those same players will have an average value for their full round. Adam Hammes, for example, with his impressive 22-under par tournament, averaged 52.67 strokes per round. By comparing the scores for a single hole to the scores for the entire tournament, and calculating R2 to quantify the strength of the relationship, we can determine the degree to which success or failure on any individual hole correlates to success or failure in the tournament.1
Figure 1: R2 relationship shown graphically between the average score on hole 1 and the average score on the course. Each individual data point represents a single player, and the positive slope indicates that success on hole 1 is correlated to success at the tournament.Results
Even before processing the data, we can make some predictions about the results. Success on an individual hole should correlate to success in the tournament overall. By necessity, in order for Adam Hammes to shoot -22, he must have birdied a lot of holes. For any individual hole, the players in the top 10 will almost certainly score better than a group of players near the cash line. But the strength of this relationship will change from hole to hole. For some holes, the top players will have performed much better than the rest of the field. We can argue then that those holes are the most critical; the specific skills they test are most important to achieve overall success.
So let’s take a look at how performance on each hole at Maple Hill was correlated to tournament performance.
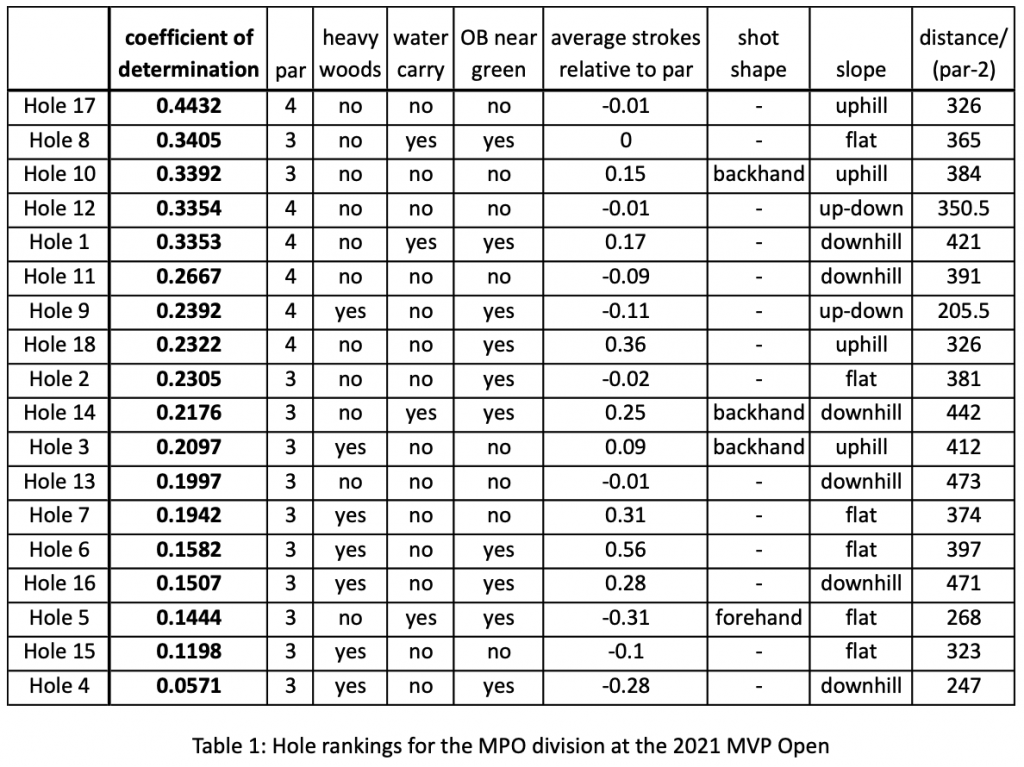
In this table, I have ranked each hole based on how strongly the score reflected the outcome of the tournament, according to the coefficient of determination (R2) value. Maple Hill’s wide variety of hole designs is reflected in the wide range of R2 values (0.44 at the highest to 0.06 at the lowest). I also listed qualities of each hole which we can use to organize this data.2
I also included some more quantitative statistical measures for each hole. First, strokes relative to par can be used as a measure of difficulty. The hardest hole on the course (hole 6) averaged 0.56 strokes over par where the easiest hole (hole 5) averaged 0.31 strokes under par. Also, I wanted to include a measure of hole distance which would allow the par 3s and par 4s to be compared. I assumed that each par 3, if played correctly, should require one hard throw while each par 4 should require two. At Maple Hill, the equation distance / (par-2) basically divides the length of the par 4s in half, but it’s also applicable to courses that feature different pars.
Par
The strongest factor that determines this ranking of R2 values is the par for each hole. All of the six par 4s are found in the top 8 among holes that most contributed to a player’s success or failure at the tournament. What qualities do the par 4s share that make them so important? I said earlier that Maple Hill has a wide variety of hole types, but that is much less true when we just compare the par 4s. Almost without exception, the par 4s include a wide-open drive followed by an approach to a heavily wooded green. Maybe these holes are important because they test both aspects of a professional disc golfer’s game: power and control? More likely, however, we can find the answer to this question by looking at the UDisc stats of strokes gained putting and strokes gained tee to green.
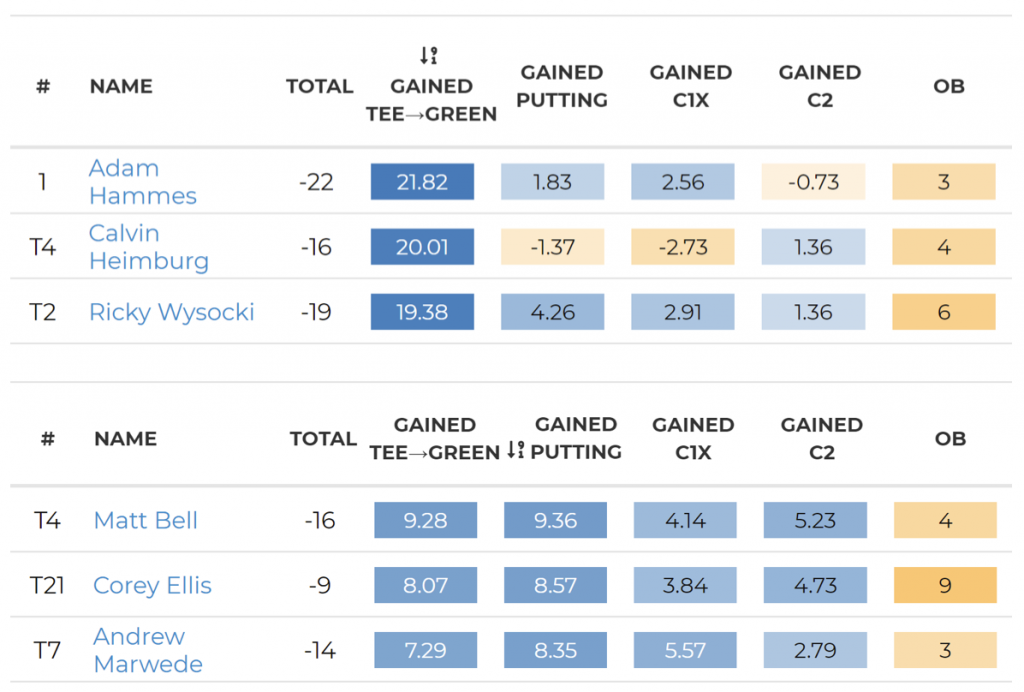
Data from UDiscLive.comThe classic golf adage is that you drive for show and putt for dough. The recent advent of advanced statistics in disc golf have shown that, in our sport at least, this is not the case. At the MVP Open, eventual winner Adam Hammes gained the most strokes on the field from tee to green with 21.82, but his putting was barely better than average. The best putting performance came from Matt Bell, who gained 9.36 points on the average player in the field. Based on this data, throwing well is twice as important as putting, and the same observation has been true at every big tournament this year. This ties back to our R2 ranking, because a larger fraction of a par 4s shots are made from tee to green. There are more potential strokes to be gained on each par 4, so the players who perform well also tend to win the tournament.
But even if this was not the case, even if putting was just as valuable as driving, par 4s would still carry more weight than par 3s. You can consider every throw in a tournament like a question on an exam. A player can throw well and get the question right, or throw poorly and get the question wrong. By design, a par 4 will require more total throws than a par 3, so there are more opportunities for good players to separate themselves. Using the exam analogy, a par 4 gives more opportunities to get the questions right. A par 4 simply accounts for a larger fraction of the total score than a par 3. At Maple Hill, the par 4s accounted for 33% of the holes but almost 40% of the total strokes in the field. If theoretically, Maple Hill had a single par 7 hole on the course, that hole would undoubtably become the most important. The result of that hole would most strongly determine a player’s success or failure at the tournament.
This gives us the first actionable piece of advice derived from the data. If you have a limited amount of time to prepare for a tournament, you should focus your efforts on the high par holes. Make sure to figure out your lines and plan your strategy, maybe even at the expense of the par 3s. By doing so, you are focusing attention on the holes most likely to influence the final outcome.
Difficulty
When starting this project, I assumed that the more difficult holes would tend to rank highly in this R2 measure of importance. After all, if a hole was too easy and everyone birdied, then it would not effectively separate the wheat from the chaff. Only on the hardest holes could the best players prove their skill by making shots that other players cannot.
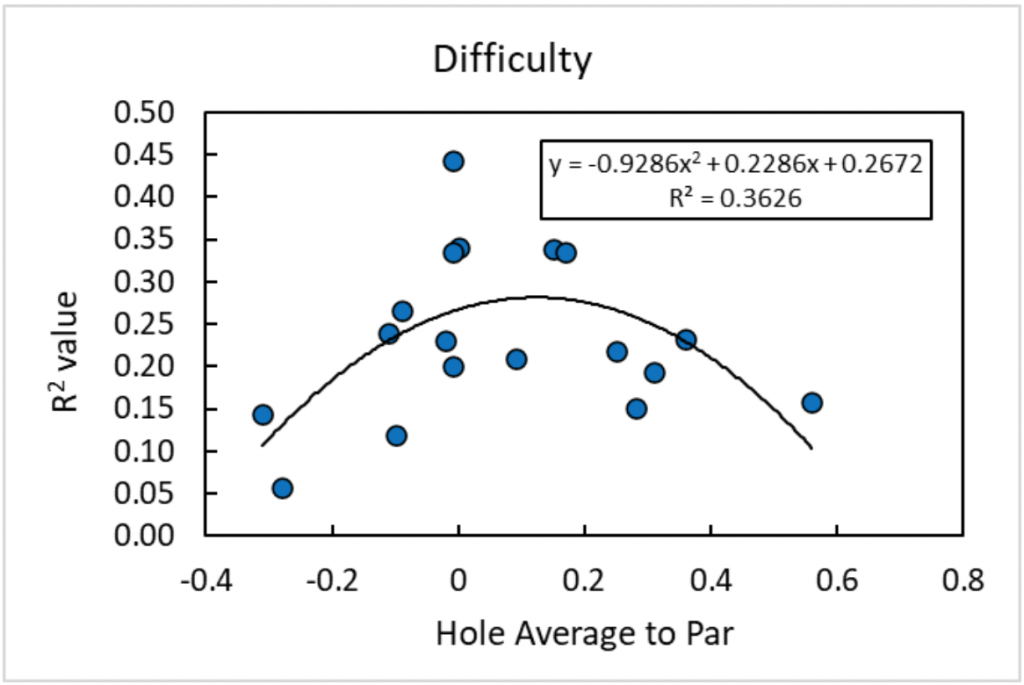
The data, however, tells a more complex story. The table does not seem to show any consistent trend. Given strokes relative to par as a measure of difficulty, easy holes are mixed with hard holes throughout the ranking. But now we have the opportunity to take the data analysis one step further and try to find a trend between the R2 data and difficulty.
Figure 3: Relationship between hole difficulty (as represented by average to par) and the importance in the tournament (as represented by the R2 value).Figure 3 shows that the relationship between hole difficulty and importance is not captured by a straight line, but instead as a curved function, here fit to a quadratic equation. The most important holes are the ones where the average score is very close to par. In other words, once a hole become too easy or too difficult, it becomes less important in determining the outcome of the tournament.
Sometimes when watching round coverage, I hear the commentators complain about “tweener” holes, ones that for example are too difficult to be called a par 3 but too easy to be called a par 4. Before this project, I was in the camp of “par is just a number” — it does not matter what the par is on any hole because it only matters how a player scores relative to the field, not how they score relative to an arbitrary number. This result, however, emphasizes the importance of setting the difficulty of each hole appropriately relative to the skill of the competitors. The presence of “tweener” holes actually damages the outcome of a tournament. At Maple Hill, the difficult hole 6 seems like a critical signature hole, when in reality it just makes the outcome of the tournament more random.
So, the second piece of actionable advice goes to course designers and tournament directors. Tournaments like Ledgestone and Idlewild seem to be in an arms race to make the most difficult course on tour. But instead of always striving for increased difficulty, it is better to set the difficulty appropriate to the players’ skill. This may be particularly true in FPO tournaments, where players are often forced to deal with holes designed for MPO power. Those tournaments end up with a lot of “tweener” holes.
Obstacles
The next factor that seems to have a significant impact on the R2 values is the presence or absence of trees. The heavily wooded holes tend to cluster near the bottom of the table. Five of the bottom six holes, the least significant in determining the outcome of the tournament, I have labeled as heavily wooded. This maybe gives credence to a feeling many disc golfers have: wooded holes can feel fluky and frustrating. The result of a hole sometimes seems unrelated to the quality of a throw. A drive that seems perfect can get knocked into the thick brush by a limb you didn’t see, while a bad shot can miss the intended line entirely but still sneak through the trees for a circle 1 putt.
This can be seen with hole 4, which by a significant margin has the lowest R2 value of any hole on the course. Hole 4 is short and steeply downhill; reaching the basket is no problem except that there is a mess of trees in the way. Players are already expected to do an awkward half throw half putt release, and then they have to hope their disc does not take a bad kick.
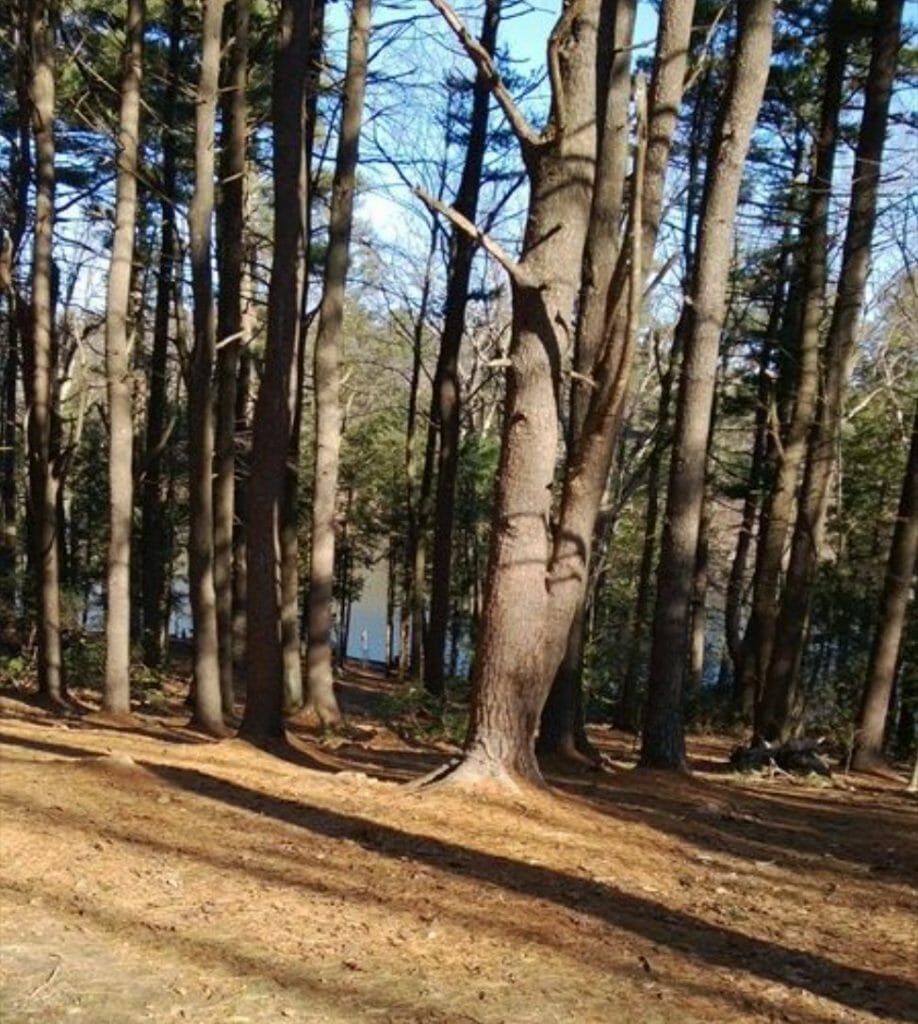
The view from the tee of hole 4. Photo: DGCourseReview.comWe could make the outcome of tournaments less random by decreasing tree cover in our courses, but doing so would destroy the character of disc golf. The Fountain Hills course in Arizona has very few trees but is hardly considered the highest ideal of a competitive disc golf course. Most ball golf adapted disc golf courses are criticized for the same reason — not enough obstacles, no shot shaping required.
All spectator sports need some combination of skill and luck to be exciting. Except as a joke, ESPN is not going to air competitive rock paper scissors (where the outcome is almost completely random) or competitive chess (where the more skilled player almost always wins). We could decrease randomness in tournaments by relocating to courses with fewer trees, but that would also make tournaments less exciting. Upsets and dramatic comebacks would occur much less frequently. In this regard, we need to find the correct balance of how much randomness is acceptable in our tournaments. Of course, any individual person will have a different level of randomness that they deem acceptable, so this has potential to be an ongoing area of debate.
This does, however, provide the third actionable piece of advice for players. If you have a low rating but are hoping to do well or win a tournament, you could consider heading to the most heavily wooded course in your area. If a tournament round is decided by 18 coinflips, then you have the opportunity, as much as anyone, to get lucky 18 times in a row.
While the presence or absence of trees plays an important factor in determining the outcome of the tournament, that does not seem to be the case for other obstacles like water and OB. There is no systematic trend of either factor influencing the R2 value for a hole. This suggests that most pro disc golfers have a strong enough mental game to treat water hazards as if they don’t exist. Perhaps this is an unstated benefit of sponsorship. Personally, I would be terrified of losing a favorite disc in one of Maple Hill’s many ponds, but a pro with easy access to more discs may see each one as more replaceable.
Distance
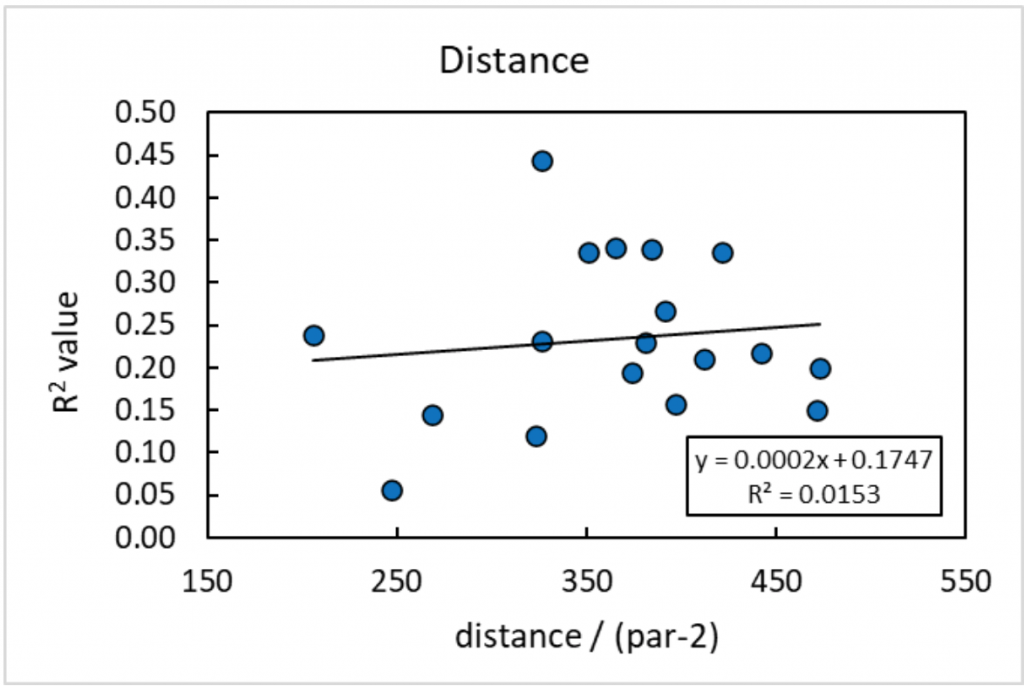
In recent years, it has seemed ever more true that elite distance is a prerequisite for becoming a professional disc golfer. The very top players are able to add control and consistency to their power, but basically everyone in MPO is able to rip a disc 500 feet. If the professional tour selects only for players with incredible distance, that suggests the ability to throw a disc far is an important factor in determining the outcome of a tournament. We might predict that top players are more comfortable throwing on longer holes and therefore the long holes would have greater significance using our R2 measure. But when we plot R2 vs distance in the same way that we plotted R2 vs difficulty earlier, we don’t observe such a trend.
Figure 4: The relationship between a hole’s distance (feet) and the degree to which it influenced the tournament result (R2)Data from the MVP Open show that top players do not gain any advantage on longer holes. This result is unintuitive enough that I am not ready to claim now that distance is an unimportant factor in disc golf skill; instead, I want to consider reasons why we don’t observe a strong trend. One additional factor that is not accounted for in this plot is the influence of elevation. Maple Hill has many holes that either go steeply uphill or steeply downhill. Hole 10, for example, is technically listed at only 384 feet, but the hole is so severely uphill that only the top fraction of even the pro field are able to reach circle 1. Maybe because of this, hole 10 has a very high R2 value, ranked third and beating even most par 4s. Conversely, hole 13, despite ostensibly requiring the longest throw at 473 feet, is very downhill and not difficult to reach, even with a midrange. Parking this hole requires angle and speed control, not elite power. Perhaps the length of a hole is important in determining who is likely to succeed in a tournament, but Maple Hill as a course is uniquely unsuited to capture its significance.
The increased distance of top players may also help them score well on par 4s in a way that is not easily captured by the data. The par 4s tend to demand one big power shot off the tee then one precise approach through the trees to the green. Players who can throw 550 feet off the tee then are left with a 250 foot upshot would be hugely advantaged compared to players who try to throw 400 feet twice. Hole 17, which is the single most important hole based on R2 values, is the prime example of this effect. Hole 17 is listed as a manageable 652 feet, but only some top players have the 550-600 feet of power required to reach the top of the hill off the tee. With a perfect drive, they will have a clear view of the basket and an easy upshot, but everyone else will have to throw it blindly over the ridge to a steep, guarded green.
I would be interested to see if data from a very long course — like the Preserve in Clearwater, Minnesota — better captures the importance of distance in separating the field.
FPO
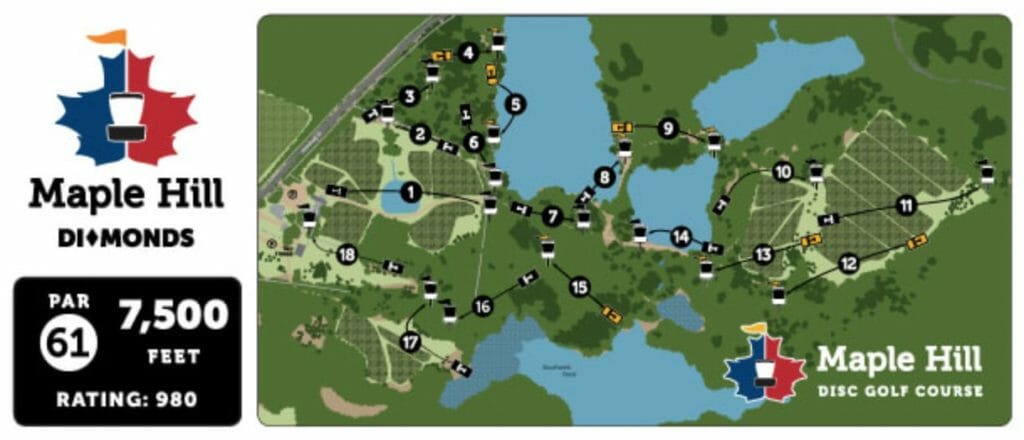
The Maple Hill Diamonds layout played by the FPO division.Now that we have established some hypotheses about what qualities make a good disc golf hole, we can see how data from the FPO field compares. In 2020, Maple Hill introduced the diamonds layout, specifically designed for the FPO division. Most of the holes are similar to the gold layout, but the differences may reveal themselves in the data. The FPO division also had fewer players in 2021, so the trends will not be as statistically significant, but enough players competed to make some observations.
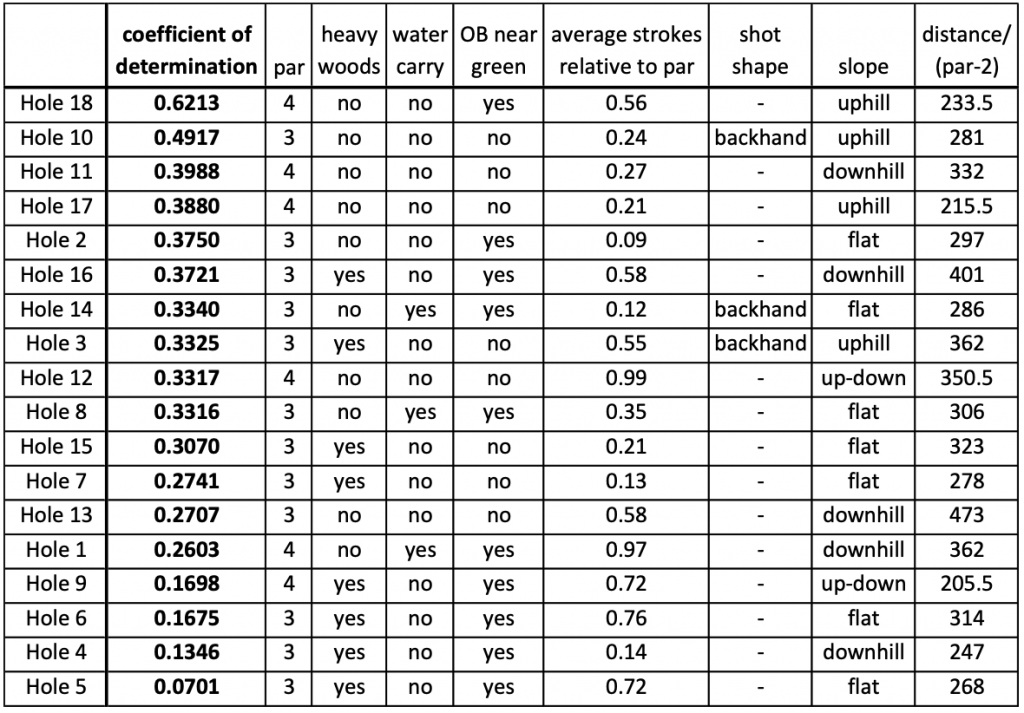
Table 2: Hole rankings for the FPO division at the 2021 MVP Open.The statistics for the FPO share many of the same characteristics as the MPO division. Par 4s tend to best predict the overall tournament result, though this trend is not as strong as in MPO. For the FPO, the presence or absence of woods is the most significant course feature in determining the importance of a hole. This is evident on hole 5, which is the most random hole for the women. The men tend to play the forehand over the water while most women throw the backhand through the woods. When throwing through the woods, one is much more likely to hit a tree, so this route adds additional randomness.
In FPO, the trend of R2 values with respect to hole difficulty is less clear. This could be a result of the wider range of skill levels in the division. The standard deviation of player ratings for participants in FPO was 38.2, much larger than 28.6 for the MPO. It is simply harder to appropriately set the difficulty of the holes when the players participating have such disparate skill. I also described earlier how it is important to set the challenge of a course at an appropriate level for the skill of the players. As the Maple Hill diamonds course is currently designed, it is a fair challenge for the top players, but it is currently too difficult for the average FPO competitor. The intended course rating of 980 is currently 67 points harder than the average rating of the FPO field. The same difference is only 20 points for MPO. Maybe this is intentional by Steve Dodge and the other designers — maybe the purpose of this tournament is to provide a challenge to the top 5-10 competitors — but I can’t imagine the average FPO player had a good experience — only one player, Catrina Allen, finished under par this year.
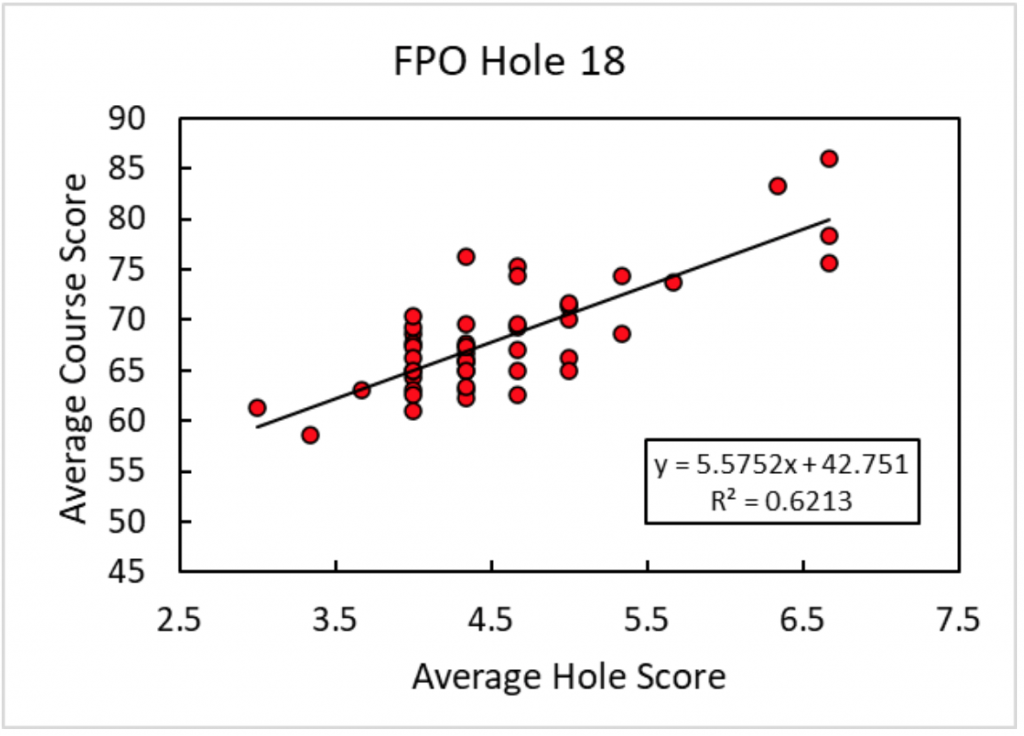
Figure 5: Relationship between the score on hole 18 and the tournament result in the FPO division. More than any other hole for either division, the outcome of this hole best predicted the tournament result.For the FPO division, hole 18 by a wide margin has the largest R2 value. Figure 5 shows this almost shockingly tight correlation. No single factor has produced this trend; instead, FPO hole 18 is just very well designed. Both the first and second shots require controlled line shaping but don’t have the randomness of the heavily wooded holes. At 467 feet uphill, the hole is long but still easily reachable by the more powerful throwers. The OB around the basket is fair and rewards smart decision making at the end of the round. Hole 18 is a signature hole on a course full of them, and it will hopefully serve as inspiration for other designers and tournament directors.
Conclusion
The Maple Hill disc golf course appealed to me for this analysis because of its diversity, and the data explored here has provided a framework with which to judge the effectiveness of a hole. We found that par 4s carry more weight in a tournament than par 3s, heavily wooded holes prevent players from leveraging their skill advantage, and the best distribution of scores will occur when players shoot near par. Maple Hill is perfect for a broad overview, but each of these conclusions could be addressed more deeply in more specialized courses. For example, at Northwood Black every hole is heavily wooded and features a mixture of par 3s, par 4s, and par 5s. Data from the Discraft Ledgestone Insurance Open played there may be suitable to testing the importance of par in isolation from other confounding variables.
Of course, I acknowledge that my method presented here, like any other attempt to quantify an infinitely complex game, has its shortcomings. For example, this analysis poorly captures the importance of putting. The goal was to analyze the differences between holes, determine which features are the most skill testing, and what shot types will lead to success. By its nature, putting does not change greatly from hole to hole. An elite disc golfer will use the same putting mechanics nearly all the time, and it’s not usually harder to putt on any hole compared to the other 17. That said, there are some slight differences we could analyze. Putting to an elevated basket may be a different skill, putting on a heavily guarded green may force a player to step out into an awkward stance, or putting near the OB may test a player’s mental strength. Fortunately, we already have access to a good statistical measure of putting — strokes gained putting — which UDisc tracks for every tournament.
Ultimately, I only hope to provoke more thought and discussion about the sport. What makes a good disc golf hole? What should designers strive for? What skills do we value most in professional players, and are courses currently set up to effectively test those skills? What skills should an average player prioritize to improve most effectively?
One question, maybe unanswerable, that I thought of during this work: Is there any hole at any course on tour where success correlates inversely with tournament performance? It is hard to imagine a hole that is worse than random, where the better players would statistically struggle more. How could such a hole even be designed? Would it be sufficient to take every rule of good course design and break them or would we have to radically reimagine what a disc golf hole even is? And one final question, that I am maybe scared to know the answer to. If I wanted to become a better player would my time have been better spent practicing instead of compiling this research? Maybe … perhaps … probably.
To calculate R2 with maximum statistical rigor, the data which composes the x and y axis (the average hole score and the average round score) should be independent of each other. This is not the case in this analysis, the score of each hole accounts for a part of the score for each round. For these calculations, we use the total round scores for ease of understanding, but similar calculations could be made by subtracting out the score on a hole from the rest of the round. Making this adjustment will decrease the average coefficient of determination (R2), but does not substantially change the trends in the data. ↩
The categories of heavily wooded, water carry, OB near green, shot shape, and slope are slightly subjective based on my own determination. Many holes are in a grey area; you could, for example, say that hole 9 includes a water carry where I don’t have it listed here. But I’d argue that the designations given here are good enough to observe trends in the data. ↩

