
Originally published at: https://discgolf.ultiworld.com/2022/09/30/why-do-pdga-rating-points-per-stroke-vary/

This is not an official PDGA statement. This analysis was done with ratings data prior to 2019.
Among the many questions players have regarding the PDGA Ratings calculations, this one has popped up again at a recent elite event when Joel Freeman’s exceptional Butler County Disc Golf Classic 14-under par final round came in rated 1077: Why does the ‘rating points per stroke’ (RPPS) get progressively smaller as the course difficulty increases?
The simple mathematical reason is that each throw added to course difficulty or total stroke count will automatically become a smaller percentage of the total strokes a player will throw. We call our course difficulty measurement the Scratch Scoring Average (SSA). This is the score we expect a 1000-rated player or player pool to average. Compare the scoring stats for the two courses shown below.
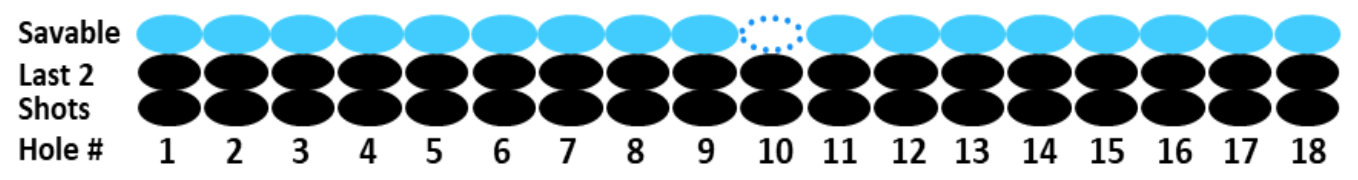
This course, C54, has 18 holes that average 3 for a 1000-rated player pool making it a course with a 54 SSA. The blue dotted disc on hole 10 shows this player threw 1 stroke less than the SSA. This SSA may not equal par set by the TD.
This course, C72, has 18 holes that average 4 for a 1000-rated pool of players making it a course with a 72 SSA. The blue dotted disc on hole 10 shows this player also threw 1 less than the SSA. Again, this SSA may not equal par set by the TD.
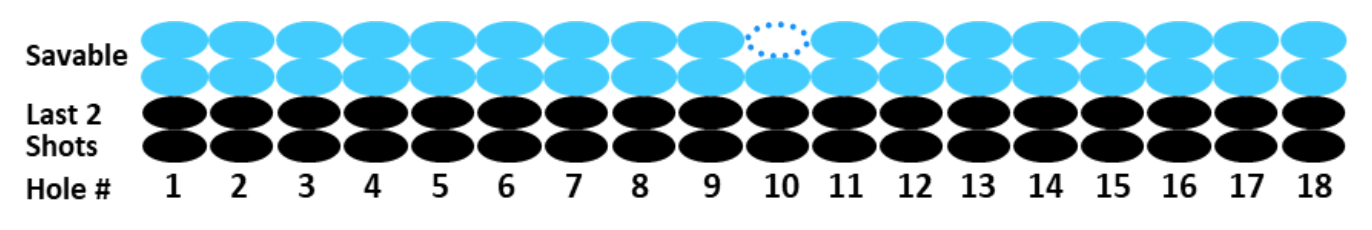
The solid blue or dotted disc for each hole shows the number of shots a player has a reasonable chance to shoot less than 3 or 4, respectively. These are considered potentially “savable” throws. The black discs on each hole show the shots that usually cannot be saved except for the rare ace or eagle. In other words, almost every disc golf hole score will include these “Last 2 Shots” that are not realistically savable.
Once we remove the Last 2 Shots from each hole score, we are left with the number of throws that can potentially be saved as a means to measure a player’s performance. On C54, 18 blue shots can be saved. On C72, 36 blue shots can be saved. So, the value of a player saving one throw on C54 equals 1 throw divided by 18 savable throws. Thus, each throw is worth 1/18=0.056 or 5.6% of the savable throws. On the 18 shots more difficult C72 course, saving one throw equals 1 divided by 36 savable throws. Thus, each throw is worth 1/36=0.028 or just 2.8% of the savable throws. Saving one throw on C54 is worth twice as much as saving one throw on C72, i.e., 5.6/2.8=2.1
The much higher stroke count in C72 vs. C54 produces the natural reduction in percentage value of a stroke. It’s the primary reason causing the “ratings points per stroke” to decrease. It’s the same reason the value of a hit in baseball or shots made in basketball decreases as at-bats and shot attempts increase. If a basketball player shoots 3 for 5 in the first half (60%), each make was worth 20% points of that 60%. If the player shoots as well in the second half going 6 for 10 overall (still 60%) for the game, each make naturally becomes worth only 10% points of that 60%, half what a make was worth in the first half.
Our C72 course example is similar to a full basketball game versus C54 being like the first half in terms of percentage stats. It’s important to note that these stats say nothing about the difficulty of each hole, amazing throws seen, and great saves or putts. We all know that every time we shoot a score of 56 on our home course, the hole scoring distribution can vary widely in terms of how many aces, birdies, pars, bogeys, and doubles were thrown on which holes. In addition, shooting par on a hole can either be routine or involve a wild save from the rough, monster putt, or a spit out on a birdie run. Stats like scores or ratings simply can’t indicate how exciting or boring the shots were during a round. Those judgments are left to the players and viewers.
Something else that complicates understanding scoring stats is that par on every course is only approximately set near a course’s 1000-rated SSA and usually set higher. So, in the examples above, if the C72 par was set at 77, it magnifies the player’s score as 6-under versus the actual 1-under SSA shown. Likewise, the C54 par may have been set at 56 so the player’s score appears as 3 under even though this player was also 1 under the 54 SSA. By tradition, hole pars and the resulting course pars have been limited to integer values, are not always set well, and even when set well can still vary from 1000-rated round scores up to nine strokes!
The good news is that the course SSA calculation in the ratings process has been consistent for over 20 years with precision at the decimal rather than the integer level. A course with a 54 SSA today still has the same RPPS as in 1999, and a course with a 72 SSA still has the same but lower RPPS than the C54 course. Only recently, though, have we seen more high-profile courses played with SSAs coming in above 66, and even 70, so their low RPPS values can appear shocking to viewers both older and newer to the game.
It may seem like we shouldn’t combine a player’s round ratings from a wide range of tournament course SSA values to update their player rating. Our ratings team did a few studies to determine whether an established player could average their rating on courses with SSAs ranging from below 48 to above 66. We tested players with established ratings from 800 up to whomever had the highest rating at the time. Within a few rating points, players in these rating ranges were, on average, able to average their rating on any course.
Here’s what happens as the course SSA increases. A player with a 1020 rating who typically shoots round ratings between 1075 and 965 on 58 SSA courses is likely to shoot round ratings that narrow down to between 1050 and 990 on 70 SSA courses. On either course, they still average 1020 ratings overall.
Comparing exceptional “best of all time” round ratings across a wide range of course SSAs works as well as comparing exceptional melons to grapes. We discovered it’s statistically more appropriate to group exceptional round ratings into 6-shot SSA categories. A true 15-under on a 54 SSA course gradually produces a lower round rating as a true 15-under the course SSA as it increases to 72 SSA in the same way we showed how stroke percentage values decrease. In ball golf, they don’t have this problem because their championship course ratings fall in a tight window roughly equivalent to our 66+ SSA range. Their tour players aren’t playing executive par 63 courses where comparing tour stats to par 72 courses would present the same challenge we’ve had in disc golf.
Note that round ratings produced for players have been shown to be automatically normalized based on our study showing players of all propagator rating levels able to average their rating on courses covering the SSA 42-72 range. However, figuring out the appropriate math to normalize exceptional rounds from the five different SSA categories is the holy grail.
What it boils down to is recognizing that going from a par 60 course to a par 63 course either by adding a par 3 hole to make 19 holes or lengthening three par 3 holes to par 4s on an 18-hole layout technically provides a slight change in the game format. It’s maybe not as extreme as going from an old school basketball game before 3-pointers to today’s version with 3-pointers but it makes comparison or normalization of exceptional performances difficult in terms of divining a fair metric to do so.
It’s in the realm of figuring out how to fairly compare exceptional players or performances between eras, like the “Greatest Of All Time” discussions in any sport. Stats are just a starting point. Subjective criteria in terms of watching and breaking down how a round score was thrown and by what player seems more important. For example, a player rated 975 shoots 9-under with no bogies. Another player rated 1025 also shoots 9-under in the same round with 2 aces, 12 birdies, no pars, a bogey, and 3 double bogeys (due to OB). Both rounds rated 1010. How do you rank their “impressiveness?”
My probabilistic approach discussed in the Fair Ways for Statistics – Part 3 seems to do a better job. You calculate the probability that a player at a specific rating will shoot the exceptional round in question. That seems to be a better way to compare exceptional rounds, but it’s in reference to the individual player’s starting point, not in reference to the SSA of the course. For example, me at 928 rating shooting a 1060 round is vastly more impressive than Ricky doing so regardless of the course.
Our disc golf Top 10 Best Rated Rounds Ever through 2018 are shown for the 5 SSA ranges tracked for MPO and FPO (PDGA hasn’t yet updated during the past 4 years). For a more in-depth understanding of ratings, par, stats, percentages and ways to rank best rounds, check out all three parts of the Fair Ways for Statistics series.
This exercise uses “perfect” courses to demonstrate percentage concepts. The actual ratings calculations developed from real course data goes beyond the basic percentage example shown. ↩